 뒤로
Unit 2 Practice Assessment Study Guide – General Biology I
스터디 가이드 - 스마트 노트
 자료에 맞춘 맞춤형 노트, 핵심 정의, 예시, 맥락을 확장해 제공합니다.
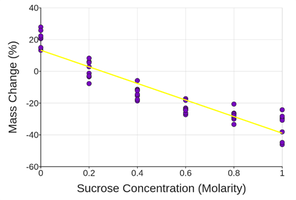
Q47. Consider the following experiment that examines the effect of a sucrose solution (sucrose + water) on red blood cell viability. Sucrose concentrations are measured in units of molarity. The solutions range from no solute to a high concentration of solute and are 0.0 (distilled water), 0.2, 0.4, 0.6, 0.8 and 1.0 molar sucrose. Red blood cells are added to the different sucrose concentrations and the new weight (mass) of the red blood cells is measured. The results of your experiment are below.
Background
Topic: Osmosis and Tonicity
This question tests your understanding of how solute concentration affects water movement across cell membranes, and how cells respond to different external environments (hypertonic, hypotonic, isotonic).
Key Terms:
Osmosis: Movement of water across a semipermeable membrane from low solute concentration to high solute concentration.
Hypertonic solution: Higher solute concentration outside the cell than inside; water leaves the cell.
Hypotonic solution: Lower solute concentration outside the cell than inside; water enters the cell.
Isotonic solution: Equal solute concentration inside and outside; no net water movement.
Step-by-Step Guidance
Examine the graph: The y-axis shows mass change (%) of red blood cells, and the x-axis shows sucrose concentration (molarity).
Notice the trend: As sucrose concentration increases, the mass change (%) decreases. This suggests that at higher sucrose concentrations, cells lose water and shrink.
Identify which solutions are hypertonic and hypotonic: Hypertonic solutions cause cells to lose mass (negative mass change), while hypotonic solutions cause cells to gain mass (positive mass change).
Estimate the isotonic point: The isotonic solution is where the mass change is zero. Find the sucrose concentration where the yellow line crosses the y=0 axis.
Use the data to infer the natural solute concentration inside the red blood cells: The isotonic point gives an estimate of the internal solute concentration.
Try solving on your own before revealing the answer!
Final Answer:
a. As sucrose concentration increases, the mass of red blood cells decreases (cells lose water).
b. Hypertonic solutions: 0.4 M and above (cells lose mass); Hypotonic solutions: 0.0 M and 0.2 M (cells gain mass).
c. The best estimate for the natural solute concentration inside the red blood cells is around 0.22 M. This is where the yellow line crosses zero on the graph, indicating no net mass change (isotonic point). The data supports this because at this concentration, water movement into and out of the cells is balanced.
