 뒤로
뒤로Chapter 3: Probability – Study Notes for Business Statistics
스터디 가이드 - 스마트 노트
 자료에 맞춘 맞춤형 노트, 핵심 정의, 예시, 맥락을 확장해 제공합니다.
Probability
Introduction to Probability
Probability is a fundamental concept in statistics, measuring the likelihood that a particular event will occur. It is expressed as a number between 0 and 1, where 0 indicates impossibility and 1 indicates certainty. Probability is essential for making statistical inferences and assessing the reliability of conclusions drawn from data.
Definition: Probability quantifies the chance of an event occurring.
Applications: Used in confidence intervals, hypothesis testing, and risk assessment in business decisions.
Examples: Probability of having a baby girl, probability of rolling a specific number on a die.
Probability Terminologies
Understanding probability requires familiarity with several key terms related to experiments and outcomes.
Experiment: An act or process of observation that leads to a single outcome, which cannot be predicted with certainty (e.g., flipping a coin, rolling a die).
Sample Point: The most basic outcome of an experiment, which cannot be further decomposed.
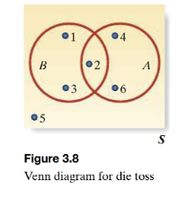
Sample Space (S): The set of all possible sample points for an experiment (e.g., S = {1, 2, 3, 4, 5, 6} for rolling a die).
Event: A collection of sample points. A simple event contains one sample point, while a compound event contains two or more.
Example: Rolling a die: A = {2, 4, 6} (even numbers, compound event); B = {2} (simple event).
Visualizing Sample Spaces
Sample spaces and events can be visualized using Venn diagrams, which help illustrate relationships between events.
Probability Rules and Calculations
Probability Rules for Sample Points
Each sample point in a sample space is assigned a probability, denoted as . The following rules apply:
All sample point probabilities must satisfy .
The sum of probabilities for all sample points in the sample space must equal 1: .
Calculating the Probability of Compound Events
The probability of an event A, denoted , is the sum of the probabilities of the sample points contained in A.
Define the experiment and describe the observation process.
List all sample points.
Assign probabilities to each sample point.
Identify the sample points in the event of interest.
Sum the probabilities of these sample points to obtain .
Formula:
Example: Rolling a die, probability of observing an even number (A = {2, 4, 6}):
Probability of an Event – Business Example
Consider the reasons businesses give for diversity training. The probability that a randomly selected business cites a business-related reason (competition or productivity) can be calculated using the provided percentages.
Reason | Percentage |
|---|---|
Comply with personnel policies (CPP) | 7 |
Increase productivity (IP) | 47 |
Stay competitive (SC) | 38 |
Social responsibility (SR) | 4 |
Other (O) | 4 |
Total | 100 |
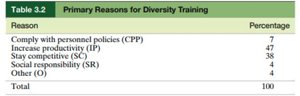
Example Calculation: Probability that the reason is business-related (IP or SC):
Example Calculation: Probability that social responsibility is not the primary reason:
Operations of Events
Union, Intersection, and Complement
Events can be combined or manipulated using set operations:
Union (A ∪ B): The event that occurs if either A or B or both occur. contains all sample points in A, B, or both.
Intersection (A ∩ B): The event that occurs if both A and B occur. contains only sample points common to both A and B.
Complement (Ac): The event that A does not occur, consisting of all sample points not in A.
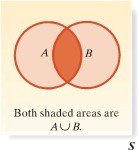
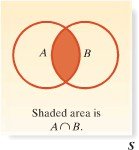
Example: In a die-toss experiment:
A: Toss an even number (A = {2, 4, 6})
B: Toss a number ≤ 3 (B = {1, 2, 3})
A ∪ B = {1, 2, 3, 4, 6}
A ∩ B = {2}
Ac = {1, 3, 5}
Rule of Complements: or
Two-Way Tables
Using Two-Way Tables in Probability
Two-way tables are used to organize data for two categorical variables, facilitating calculation of joint, marginal, and conditional probabilities.
Age | <$25,000 | $25,000–$50,000 | >$50,000 |
|---|---|---|---|
<30 yr | 5% | 12% | 10% |
30–50 yr | 14% | 22% | 16% |
>50 yr | 8% | 10% | 3% |
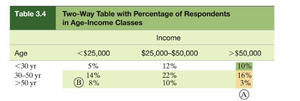
Example: Probability that a randomly selected respondent is aged 30–50 years and has income >P(30\text{–}50\text{ yr and } >
Example: Probability that a respondent is aged >50 years:
Additional Probability Rules
Multiplication and Combination Rules
Multiplication and combination rules are used to calculate probabilities in experiments involving multiple stages or selections.
Multiplication Rule: Used for finding the probability of the intersection of independent events.
Combination Rule: Used to count the number of ways to select items from a set without regard to order.
Formula for combinations:
Example: If 86 candies are available, the number of pairwise comparisons is
Example: Probability that two selected candies are both Reese’s products (4 out of 86): possible pairs; probability =
Summary
Probability provides the foundation for statistical inference and decision-making in business contexts. Understanding experiments, sample spaces, events, and probability rules is essential for analyzing data and making reliable conclusions.
