 뒤로
뒤로Chapter 10
스터디 가이드 - 스마트 노트
 자료에 맞춘 맞춤형 노트, 핵심 정의, 예시, 맥락을 확장해 제공합니다.
Hypothesis Testing for Two Samples
Overview
Hypothesis testing for two samples is a fundamental technique in business statistics used to compare population parameters, such as means and proportions, between two groups. This chapter focuses on the procedures for testing claims about differences in means and proportions using independent and dependent samples, and provides step-by-step guidance for conducting these tests.
Types of Two-Sample Tests
Comparing Two Population Means: Tests whether the means of two populations are equal or different.
Comparing Two Population Proportions: Tests whether the proportions of two populations are equal or different.
Independent Samples: Samples from two populations are unrelated.
Dependent Samples: Samples are paired or matched (e.g., before and after treatment).
Step-by-Step Procedure for Hypothesis Testing
Identify the null and alternative hypotheses (H0 & H1): Specify the claim to be tested.
Set the significance level (α): Common values are 0.01, 0.05, or 0.1.
Determine the critical value: Use Z or t tables depending on known or unknown population standard deviations.
Calculate the test statistic: Use appropriate formulas for Z or t tests.
Compare test statistic and critical value: Decide whether to reject or fail to reject H0.
State the conclusion: Interpret the result in the context of the problem.
Comparing Two Population Means with Independent Samples
Known Population Standard Deviations (σ1 & σ2)
When the population standard deviations are known, the Z-test is used to compare the means of two independent samples.
Mean of the Sampling Distribution:
Standard Error:
Z-Test Statistic:
Example: Comparing Fan Spending in Chicago and New York
Chicago: , ,
New York: , ,
Hypotheses: ,
Significance level:
Critical value:
Calculated
Conclusion: → Reject
Unknown Population Standard Deviations (σ1 & σ2)
When population standard deviations are unknown, use sample standard deviations and the t-distribution.
Equal Variances: Use pooled variance and t-test statistic:
Unequal Variances: Use separate variances and adjusted degrees of freedom.

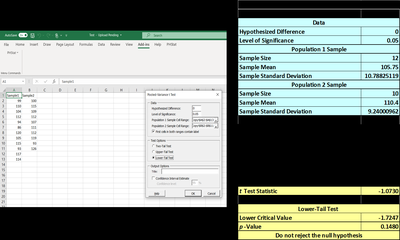
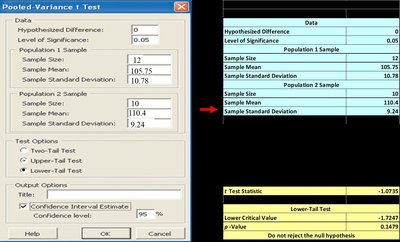
Example: Comparing Travel Times for Two Routes
Bob's route: , ,
Deb's route: , ,
Hypotheses: ,
Significance level:
Critical value:
Calculated
Conclusion: → Fail to reject
Comparing Two Population Proportions with Independent Samples
Hypothesis Testing for Proportions
Used to compare the proportions of two populations using independent samples.
Standard Error:
Z-Test Statistic:
Example: Voting Proportions for Men and Women
Men: , ,
Women: , ,
Hypotheses: ,
Significance level:
Critical value:
Calculated
Conclusion: → Fail to reject
Decision Rules for Hypothesis Testing
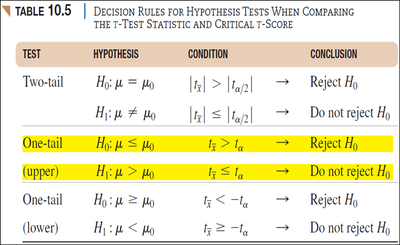
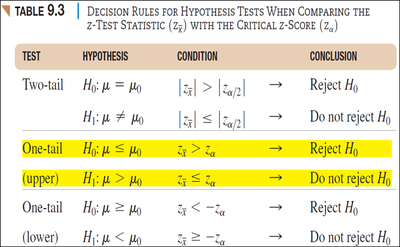
Decision Rules for t-Test and Z-Test
Decision rules help determine whether to reject or fail to reject the null hypothesis based on the comparison of the test statistic and the critical value.
Test | Hypothesis | Condition | Conclusion |
|---|---|---|---|
Two-tail | Reject | ||
Two-tail | Do not reject | ||
One-tail (upper) | Reject | ||
One-tail (upper) | Do not reject | ||
One-tail (lower) | Reject | ||
One-tail (lower) | Do not reject |
Test | Hypothesis | Condition | Conclusion |
|---|---|---|---|
Two-tail | Reject | ||
Two-tail | Do not reject | ||
One-tail (upper) | Reject | ||
One-tail (upper) | Do not reject | ||
One-tail (lower) | Reject | ||
One-tail (lower) | Do not reject |
Applications and Interpretation
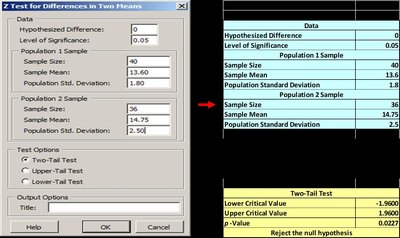
Using Excel/PHStat for Hypothesis Testing
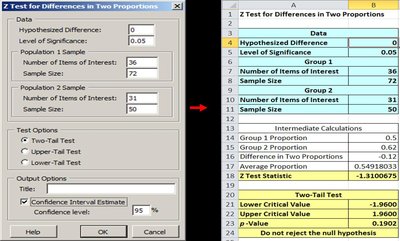
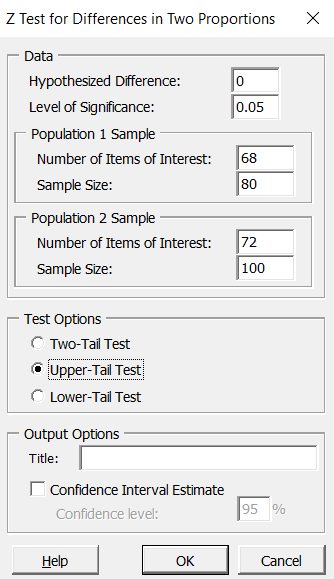
Excel and PHStat can be used to perform two-sample tests for means and proportions.
Input sample sizes, means, standard deviations, and select test options (two-tail, upper-tail, lower-tail).
Interpret output: test statistic, critical value, p-value, and conclusion.
Interpreting Confidence Intervals
If the confidence interval for the difference between means or proportions does not include zero, there is evidence of a significant difference.
If the interval includes zero, there is no evidence of a significant difference.
Summary
Hypothesis testing for two samples allows comparison of means and proportions between groups.
Use Z-tests for known population standard deviations and t-tests for unknown standard deviations.
Decision rules guide whether to reject or fail to reject the null hypothesis.
Excel/PHStat provides practical tools for conducting these tests and interpreting results.
