 뒤로
뒤로Hypothesis Tests and Estimation for Population Variance: Chi-Square and F-Tests
스터디 가이드 - 스마트 노트
 자료에 맞춘 맞춤형 노트, 핵심 정의, 예시, 맥락을 확장해 제공합니다.
Chapter 11: Hypothesis Tests and Estimation for Population Variance
Introduction
This chapter focuses on statistical methods for testing and estimating population variances, which are crucial for quality control and business decision-making. The main tools discussed are the chi-square test for a single population variance and the F-test for comparing two population variances.
Variance: Definition and Importance
What is Variance?
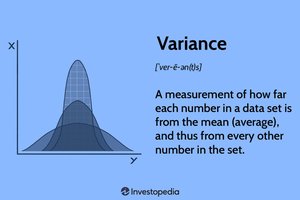
Variance is a fundamental measure in statistics that quantifies how far each number in a data set is from the mean (average), and thus from every other number in the set.
Definition: Variance is the average of the squared differences from the mean.
Formula:
Application: Used to assess consistency and quality in manufacturing, service times, and other business processes.
Why Use Variance Instead of Standard Deviation?
Statistical Tests: Most tests are formulated for variance (), not standard deviation ().
Mathematical Properties: Variance allows for easier manipulation in equations, as addition and subtraction are not straightforward with square roots.
Hypothesis Testing for Single Population Variance
Chi-Square Test for Variance
The chi-square test is used to determine if the variance of a population differs from a specified value. It is based on the chi-square distribution, which is right-skewed and starts at zero.
Assumptions: The population is normally distributed.
Test Statistic:
Degrees of Freedom:

Chi-Square Distribution Characteristics
Shape: Right-skewed, never negative.
Degrees of Freedom:

Hypothesis Testing Steps
State the Null and Alternate Hypotheses:
Select a Level of Significance: Common values are 0.05 or 0.10.
Identify the Test Statistic: Use the chi-square formula above.
Formulate the Decision Rule: Compare the test statistic to the critical value from the chi-square table.
Take a Sample and Arrive at a Decision: If the test statistic falls in the rejection region, reject .
Interpret the Results: State whether there is evidence to support a change in variance.
Example: Valley Appliance Repair
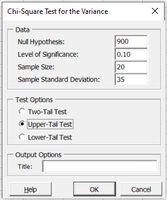
Population standard deviation: 30 minutes ()
Sample standard deviation: 35 minutes ()
Sample size: 20 ()
Null hypothesis:
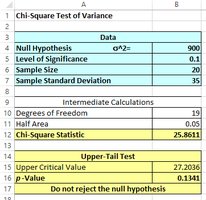
Test statistic:
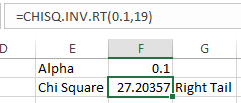
Critical value (right tail, , ): 27.20
Decision: Test statistic is not in the rejection region. Fail to reject the null hypothesis.
Decision Rules for Hypothesis Tests
Types of Tests
Left-Tail: Reject if
Right-Tail: Reject if
Two-Tail: Reject if or




Confidence Intervals for Population Variance
Confidence Interval Formula
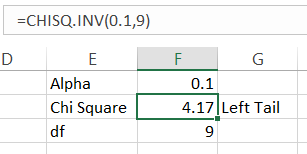
Confidence intervals estimate the range in which the true population variance is likely to fall, based on sample data.
Formula:
Interpretation: With a specified confidence level (e.g., 95%), the true variance lies within the calculated interval.
Example: Small Theater Snack Bar Sales
Sample size: 14
Sample standard deviation: $38.60
Sample variance:
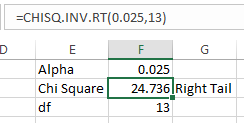
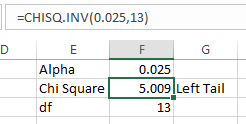
Degrees of freedom: $13$
Confidence interval for variance:
Confidence interval for standard deviation:
Hypothesis Tests for Two Population Variances
F-Test for Comparing Two Variances
The F-test is used to compare the variances of two independent samples to determine if they are significantly different.
Assumptions: Both populations are normally distributed; samples are independent.
Test Statistic: (where is the larger sample variance)
Degrees of Freedom: ,


Example: Fast Food Drive-Thru Wait Times
System 1: , seconds,
System 2: , seconds,
Test statistic:
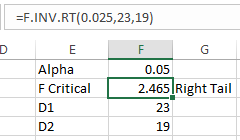
Critical value (two-tailed, , , ): 2.465
Decision: Test statistic is not in the rejection region. Fail to reject the null hypothesis.

Summary Table: Hypothesis Test for Variance
Step | Description |
|---|---|
1 | State Hypotheses (, ) |
2 | Select Significance Level () |
3 | Identify Test Statistic (Chi-square or F) |
4 | Formulate Decision Rule (Critical Value) |
5 | Calculate Test Statistic |
6 | Make Decision (Reject/Fail to Reject ) |
7 | Interpret Results |
Key Formulas
Chi-Square Test Statistic:
F-Test Statistic:
Confidence Interval for Variance:
Conclusion
Testing and estimating population variances are essential for business statistics, especially in quality control and process improvement. The chi-square and F-tests provide rigorous methods for evaluating variability and making informed decisions based on data.
