 뒤로
뒤로Methods for Describing Sets of Data (II): Measures of Variability and Relative Standing
스터디 가이드 - 스마트 노트
 자료에 맞춘 맞춤형 노트, 핵심 정의, 예시, 맥락을 확장해 제공합니다.
Numerical Measures of Variability
Range
The range is a simple measure of variability in a quantitative data set. It is calculated as the difference between the largest and smallest values in the data set. While easy to compute and understand, the range is not sensitive to the distribution of data, especially in large data sets, as it only considers the two extreme values.
Definition: Range = Largest value − Smallest value
Interpretation: A larger range indicates greater variability in the data set.
Limitation: The range does not reflect how data are distributed between the extremes.
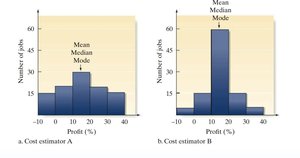
Example: Comparing profit margins for two cost estimators across 100 construction jobs can illustrate differences in variability, even if the means are similar.
Variance and Standard Deviation
The variance and standard deviation are more comprehensive measures of variability. They consider how each data point deviates from the mean, providing a sense of overall spread.
Deviation: The difference between a data point and the mean (can be positive or negative).
Sample Variance (s2): The average of the squared deviations from the sample mean.
Sample Standard Deviation (s): The square root of the sample variance.
Formulas:
Sample Variance:
Sample Standard Deviation:
Population Variance:
Population Standard Deviation:
Interpretation: The standard deviation is in the same units as the data and is widely used to describe data spread.
Other Measures of Variation
Other measures, such as the interquartile range (IQR), focus on the spread of the middle 50% of data and are less sensitive to outliers.
IQR: Difference between the 75th percentile (Q3) and the 25th percentile (Q1).
Formula:
The Empirical Rule
Understanding the Empirical Rule
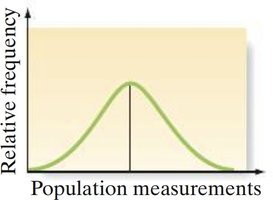
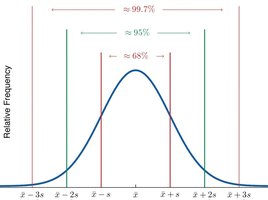
The Empirical Rule describes the distribution of data in a bell-shaped (mound-shaped and symmetric) histogram. It provides approximate percentages of data within certain numbers of standard deviations from the mean.
About 68% of data falls within 1 standard deviation of the mean.
About 95% falls within 2 standard deviations.
About 99.7% falls within 3 standard deviations.
Formulas:
For a sample: , ,
For a population: , ,
Applications of the Empirical Rule
The Empirical Rule is useful for estimating the proportion of data within certain intervals and for making statistical inferences about the likelihood of events.
Estimating Percentages: For example, if the mean and standard deviation of a data set are known, you can estimate the percentage of observations within 1, 2, or 3 standard deviations of the mean.
Statistical Inference: The rule helps assess how unusual a particular observation is, given the mean and standard deviation.
Example: If a manufacturer claims an average battery life of 60 months with a standard deviation of 10 months, the Empirical Rule can estimate the percentage of batteries lasting less than a certain number of months.
Numerical Measures of Relative Standing
Percentiles
Percentiles indicate the relative standing of a value within a data set. The pth percentile is the value below which p% of the data falls.
Common percentiles: 25th (Q1), 50th (median, Q2), 75th (Q3)
Percentiles are especially useful for large data sets, such as standardized test scores or sales figures.
Percentiles are usually calculated using statistical software.
Formula for Percentile Rank:
Rank position = , where p is the desired percentile and n is the number of data points.
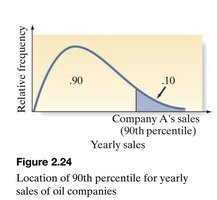
Example: The 90th percentile for yearly sales marks the value below which 90% of companies fall.
Quartiles
Quartiles divide the data set into four equal parts:
Q1: 25th percentile (lower quartile)
Q2: 50th percentile (median)
Q3: 75th percentile (upper quartile)
Example: For the data set 12, 15, 18, 20, 22, 25, 28, 30, 35, 40:
Q2 (Median): (22 + 25)/2 = 23.5
Q1: Median of lower half = 18
Q3: Median of upper half = 30
z-Score
The z-score measures how many standard deviations a data point is from the mean. It is a standardized measure of relative standing.
Sample z-score:
Population z-score:
A z-score tells you how far (and in what direction) a value is from the mean.
Interpretation:
z-scores between -1 and 1: typical values (about 68% of data)
z-scores between -2 and 2: not unusual (about 95% of data)
z-scores beyond -2 or 2: unusually low or high values
Example: If the mean GMAT score is 540 with a standard deviation of 100, a score of 440 has a z-score of . This is not considered surprisingly low, as it is within two standard deviations of the mean.
Tabular Data Example
The following table presents R&D percentages for 50 companies, illustrating how data can be organized for analysis of variability and relative standing.
R&D Percentages for 50 Companies | ||||||||||
|---|---|---|---|---|---|---|---|---|---|---|
13.5 | 9.1 | 9.5 | 8.2 | 6.5 | 8.4 | 8.1 | 6.9 | 7.5 | 10.5 | 13.5 |
7.2 | 7.1 | 9.0 | 9.9 | 8.2 | 13.2 | 8.2 | 6.2 | 9.0 | 8.7 | |
9.7 | 7.5 | 7.2 | 9.9 | 8.6 | 11.1 | 8.2 | 6.0 | 10.6 | 8.2 | |
11.3 | 5.6 | 10.1 | 8.0 | 8.5 | 11.7 | 7.1 | 7.7 | 9.4 | 6.0 | |
8.0 | 7.4 | 10.8 | 7.8 | 7.9 | 6.5 | 6.9 | 6.3 | 6.8 | 9.5 |
Additional info: This table can be used to practice calculating measures such as the mean, median, range, variance, standard deviation, percentiles, and z-scores.
