 뒤로
뒤로Chapter 9
스터디 가이드 - 스마트 노트
 자료에 맞춘 맞춤형 노트, 핵심 정의, 예시, 맥락을 확장해 제공합니다.
Hypothesis Testing for One Sample
Decision Rules for Hypothesis Testing
When conducting hypothesis tests for a single population mean, the decision to reject or not reject the null hypothesis (H0) is based on comparing the calculated test statistic (z or t) to a critical value from the appropriate distribution. The rules differ for two-tailed and one-tailed tests, and for whether the population standard deviation is known or unknown.
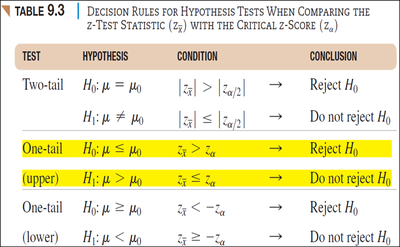
Decision Rules for the z-Test Statistic (σ Known)
Two-tailed test: Reject H0 if ; otherwise, do not reject H0.
One-tailed test (upper): Reject H0 if ; otherwise, do not reject H0.
One-tailed test (lower): Reject H0 if ; otherwise, do not reject H0.
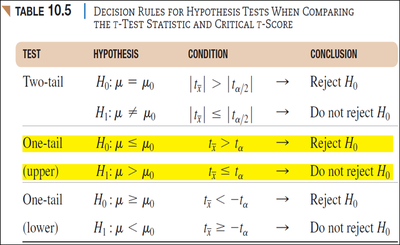
Decision Rules for the t-Test Statistic (σ Unknown)
Two-tailed test: Reject H0 if ; otherwise, do not reject H0.
One-tailed test (upper): Reject H0 if ; otherwise, do not reject H0.
One-tailed test (lower): Reject H0 if ; otherwise, do not reject H0.
One-Sample z-Test: Population Standard Deviation Known
The one-sample z-test is used when the population standard deviation (σ) is known. The test statistic is calculated as:
Test Statistic Formula:
Where: = sample mean = hypothesized population mean = population standard deviation = sample size
Example: Upper-Tailed z-Test
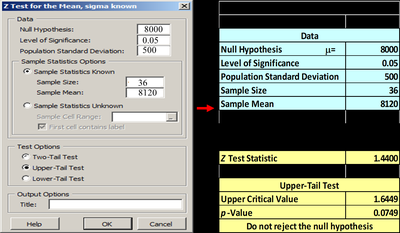
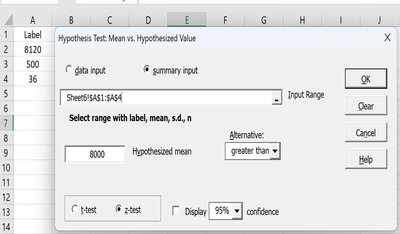
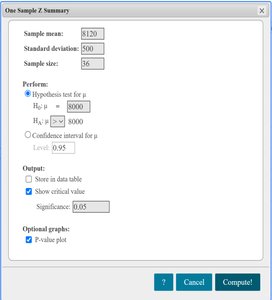
Suppose a manufacturer claims that the average life of a light bulb is at least 8,000 hours. A sample of 36 bulbs has a mean life of 8,120 hours and σ = 500 hours. Test at α = 0.05 if the average life exceeds 8,000 hours.
Step 1: State hypotheses:
Step 2: Significance level:
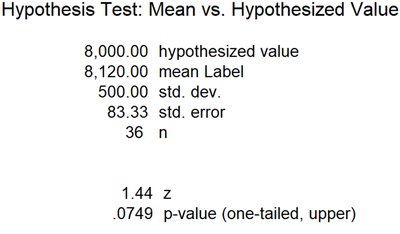
Step 3: Calculate test statistic:
Step 4: Critical value:
Step 5: Compare: → Do not reject
Step 6: Conclusion: Not enough evidence to support the claim that the average life exceeds 8,000 hours.
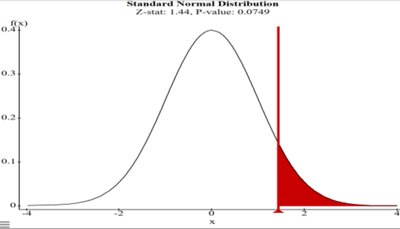
One-Sample z-Test: Two-Tailed Example
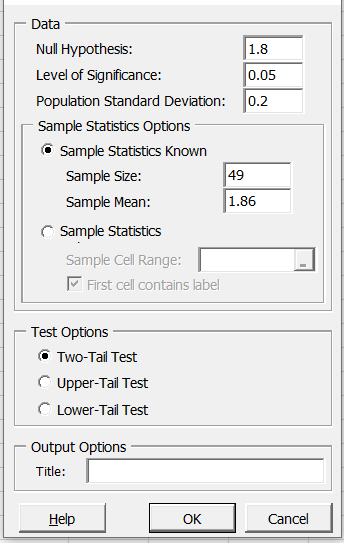
Suppose the mean data use for smartphone users is claimed to be 1.8 GB/month. A sample of 49 users has a mean of 1.86 GB, σ = 0.2 GB. Test at α = 0.05 if the average use differs from 1.8 GB.
Step 1: ,
Step 2:
Step 3:
Step 4: Critical value:
Step 5: → Reject
Step 6: Conclusion: Sufficient evidence to reject the null hypothesis; average use is not equal to 1.8 GB.
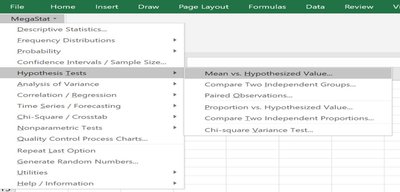
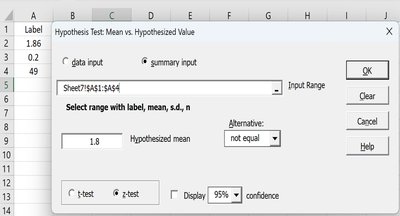
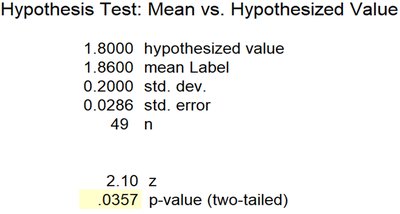
One-Sample z-Test: Lower-Tailed Example
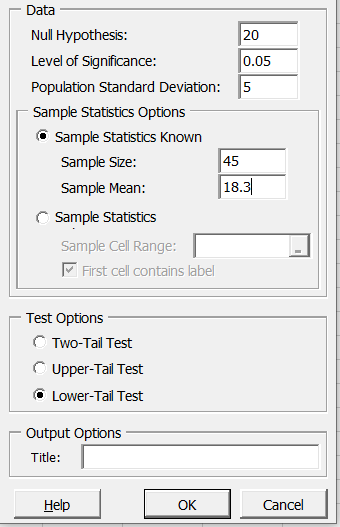
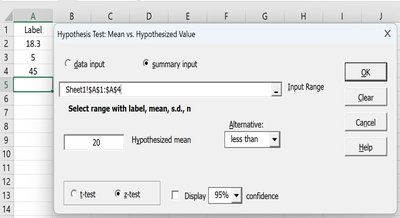
Lindsay wants to test if the average wait time at her restaurant is less than 20 minutes. A sample of 45 wait times has a mean of 18.3 minutes, σ = 5 minutes. Test at α = 0.05.
Step 1: ,
Step 2:
Step 3:
Step 4: Critical value:
Step 5: → Reject
Step 6: Conclusion: Evidence supports that the average wait time is less than 20 minutes.
One-Sample t-Test: Population Standard Deviation Unknown
When the population standard deviation is unknown, the t-test is used. The test statistic is:
Test Statistic Formula:
Where: = sample standard deviation Degrees of freedom:
Summary Table: Decision Rules for z and t Tests
Test | Hypothesis | Condition | Conclusion |
|---|---|---|---|
Two-tail (z or t) | or | Reject | |
Two-tail (z or t) | or | Do not reject | |
One-tail (upper) | or | Reject | |
One-tail (upper) | or | Do not reject | |
One-tail (lower) | or | Reject | |
One-tail (lower) | or | Do not reject |
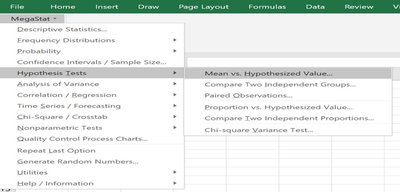
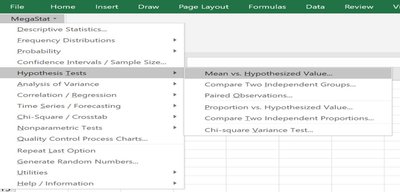
Additional info: The images included above are directly relevant to the calculation and interpretation of hypothesis tests for one sample, including the use of statistical software (Excel, MegaStat, StatCrunch) for hypothesis testing. The summary table provides a concise reference for decision rules in both z and t tests.
