 뒤로
One-Sample Hypothesis Testing: Principles and Applications
스터디 가이드 - 스마트 노트
 자료에 맞춘 맞춤형 노트, 핵심 정의, 예시, 맥락을 확장해 제공합니다.
One-Sample Hypothesis Testing
Introduction to Hypothesis Testing
Hypothesis testing is a fundamental statistical tool used to make inferences about population parameters based on sample data. It helps answer questions such as whether a process has improved, or if a population mean or proportion has changed.
Hypothesis: A claim or assertion about a population parameter (e.g., mean, proportion).
Examples: "The mean monthly cell phone bill is $42" or "The proportion of adults with cell phones is 0.68".
Null and Alternative Hypotheses
In hypothesis testing, two competing hypotheses are formulated:
Null Hypothesis (H0): The default or status quo claim (e.g., no change, no effect).
Alternative Hypothesis (H1): The claim we seek evidence for (e.g., a change, an effect).
Types of Hypothesis Tests
Depending on the parameter and the research question, different types of tests are used:
Test for a Population Mean (left-tailed, right-tailed, two-tailed)
Test for a Population Proportion
Test for a Population Variance
Principles of Hypothesis Testing
Sampling and Decision Making
Hypothesis testing involves collecting a random sample and comparing the sample statistic to the hypothesized population parameter. The decision to reject or not reject H0 depends on how far the sample statistic is from the hypothesized value.
If the sample mean is close to the hypothesized mean, do not reject H0.
If the sample mean is far from the hypothesized mean, reject H0.
Critical Values and Rejection Regions
Critical values define the boundaries of the rejection region. If the test statistic falls in this region, H0 is rejected.
Critical Value: The threshold value that separates the rejection region from the non-rejection region.
Errors in Hypothesis Testing
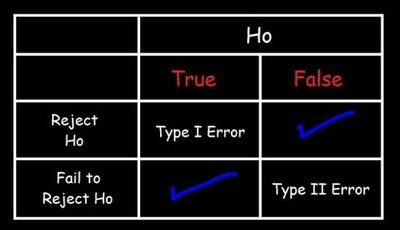
Two types of errors can occur in hypothesis testing:
Type I Error (α): Rejecting a true null hypothesis (false positive).
Type II Error (β): Failing to reject a false null hypothesis (false negative).
Level of Significance (α)
The level of significance (α) is the probability of making a Type I error. It is set by the researcher (commonly 0.05 or 0.01) and determines the size of the rejection region.
Procedure for Hypothesis Testing
The general steps for conducting a hypothesis test are:
State the null and alternative hypotheses.
Select the level of significance (α).
Collect data and calculate the test statistic.
Determine the critical value(s) and rejection region(s).
Make a decision: reject or do not reject H0.
Hypothesis Tests for the Mean
Z-Test (Population Variance Known)
When the population standard deviation (σ) is known, the Z-test is used. The test statistic is:
Example: Testing if the average net income for sole proprietor CPAs has changed from $79,414, using a sample mean and known σ.
t-Test (Population Variance Unknown)
When σ is unknown, the t-test is used with the sample standard deviation (S):
Example: Testing if the average size of farms has increased, using a sample of farm sizes and the sample standard deviation.
p-Value Approach
Definition and Interpretation
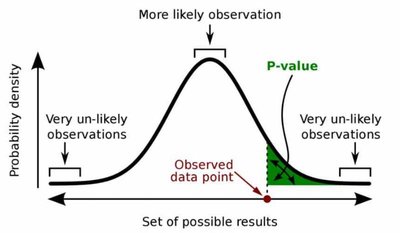
The p-value is the probability of obtaining a test statistic as extreme as, or more extreme than, the observed value, assuming H0 is true. It is compared to α to make a decision:
If p-value < α, reject H0.
If p-value ≥ α, do not reject H0.
Strength of Evidence
p-value | Interpretation |
|---|---|
> 0.10 | No evidence against H0 |
0.05 – 0.10 | Weak evidence against H0 |
0.01 – 0.05 | Moderate evidence against H0 |
< 0.01 | Strong evidence against H0 |
One-Tailed and Two-Tailed Tests
One-Tailed Tests
Used when the alternative hypothesis specifies a direction (greater than or less than). Only one critical value is used.
Left-tailed test: H0: μ ≥ μ0, H1: μ < μ0
Right-tailed test: H0: μ ≤ μ0, H1: μ > μ0
Two-Tailed Tests
Used when the alternative hypothesis is non-directional (not equal to). Two critical values are used, one in each tail.
Hypothesis Tests for Proportions
Testing a Proportion
Used for categorical variables with two possible outcomes. The sample proportion (p) is compared to the hypothesized population proportion (π).
Test Statistic:
When both X and n – X are at least 10, the normal approximation is valid.
Example
Testing if the response rate to a survey is different from 8% using a sample of 500 and 25 responses.
Hypothesis Tests for Variance
Testing a Variance
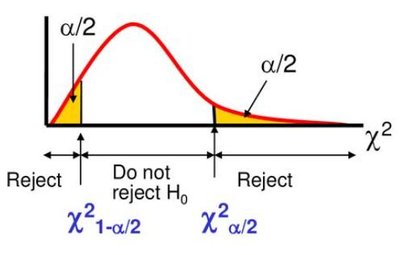
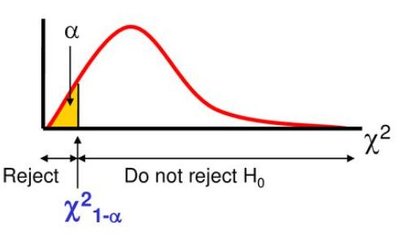
Used to compare the variance of a process to a benchmark or specification, often in quality control.
Test Statistic: The chi-square (χ²) test is used for variance.
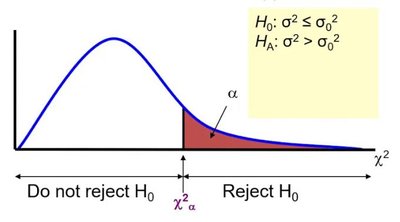
Summary Table: Types of Hypothesis Tests
Parameter | Population Variance Known? | Test Statistic | Distribution |
|---|---|---|---|
Mean (μ) | Yes | Z | Standard Normal |
Mean (μ) | No | t | Student's t |
Proportion (π) | n/a | Z | Standard Normal |
Variance (σ²) | n/a | χ² | Chi-square |
Conclusion
One-sample hypothesis testing is a powerful tool for making inferences about population parameters. By following a structured process and understanding the types of errors and tests, business decisions can be made with statistical confidence.
