 뒤로
Two-Sample Hypothesis Testing: Means, Proportions, and Variances
스터디 가이드 - 스마트 노트
 자료에 맞춘 맞춤형 노트, 핵심 정의, 예시, 맥락을 확장해 제공합니다.
Comparing Two Populations: Two-Sample Hypothesis Tests
Introduction to Two-Sample Tests
Two-sample hypothesis tests are used to compare estimates from two independent samples to determine if there is a statistically significant difference between their corresponding population parameters. These tests are fundamental in business statistics for comparing means, proportions, and variances across different groups or treatments.
Purpose: To assess whether observed differences between two groups are due to random variation or reflect true population differences.
Applications: Comparing product performance, treatment effects, or market segments.
Comparing Two Means
Independent Samples
When two samples are drawn independently from two populations, we often wish to test hypotheses or construct confidence intervals for the difference in their means, denoted as .
Point Estimate:
Types of Tests:
Lower-tail: vs.
Upper-tail: vs.
Two-tail: vs.
Case 1: Population Variances Known
Assumptions: Random, independent samples; populations are normal or .
Test Statistic:
Confidence Interval:
Case 2: Population Variances Unknown but Assumed Equal (Pooled-Variance t Test)
Assumptions: Random, independent samples; populations are normal or ; equal variances.
Pooled Variance:
Test Statistic:
Degrees of Freedom:
Confidence Interval:

Case 3: Population Variances Unknown and Not Assumed Equal (Welch’s t Test)
Assumptions: Random, independent samples; populations are normal or ; unequal variances.
Test Statistic:
Degrees of Freedom (Welch’s approximation):
Paired Samples (Dependent Samples)
Paired sample tests are used when observations in one sample can be paired with observations in the other (e.g., before-and-after measurements on the same subjects).
Difference for each pair:
Mean difference:
Sample standard deviation of differences:
Test Statistic:
Degrees of Freedom:
Confidence Interval:
Comparing Two Proportions
Two-Sample Proportion Tests
These tests compare the proportions of a characteristic in two independent populations. The point estimate for the difference is .
Assumptions: Each sample is random and independent; , , , (normality criterion).
Pooled Proportion:
Test Statistic:
Confidence Interval:
Comparing Two Variances
F-Test for Equality of Variances
The F-test is used to compare the variances of two independent populations. The test statistic is the ratio of the sample variances.
Test Statistic:
Degrees of Freedom: Numerator , Denominator
Hypotheses:
(two-tailed)
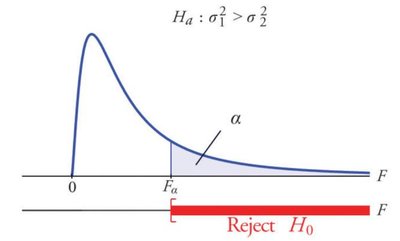
Summary Table: Two-Sample Test Selection
Parameter | Test | Assumptions | Test Statistic |
|---|---|---|---|
Means (independent, variances known) | Z-test | Normality or large n, known variances | |
Means (independent, variances unknown, equal) | Pooled t-test | Normality or large n, equal variances | |
Means (independent, variances unknown, unequal) | Welch’s t-test | Normality or large n, unequal variances | |
Means (paired samples) | Paired t-test | Normality of differences | |
Proportions | Z-test for proportions | Normality of sample proportions | |
Variances | F-test | Normality |
Additional info: These tests are foundational for inferential statistics in business, allowing analysts to make data-driven decisions about differences between groups, treatments, or market segments. Always check assumptions before applying each test.
PROMPT QUESTION
Big-picture concept: “Explain what a two-sample hypothesis test is and why it is useful in business. In your answer, discuss the purpose of comparing two groups and how statistical significance helps distinguish real differences from random variation.”
Choosing the correct test: “Given a business scenario with two groups, explain how you would decide whether to use:
(1) a two-sample Z test for means (variances known),
(2) a pooled-variance t test (variances unknown but assumed equal),
(3) Welch’s t test (variances unknown and not assumed equal),
(4) a paired t test,
(5) a two-proportion Z test, or
(6) an F test for variances.
State the assumptions that drive your choice.”
Comparing two means (independent samples): “Describe how to test a hypothesis about the difference in two population means, mu 1- mu 2 . Define the point estimate X overbar₁- X overbar₂ , describe the form of the null/alternative hypotheses (lower-tail, upper-tail, two-tail), and explain what changes across the known-variance Z test vs. the two t-test approaches.”
Pooled vs. Welch t test: “Explain the difference between the pooled-variance t test and Welch’s t test. Include (a) the equal-variance assumption, (b) the pooled variance formula Sₚ²=((n 1- 1) S 1 squared+ (n 2- 1) S 2 squared/n 1+ n 2- 2) , and (c) how degrees of freedom are determined in each case (exact n 1+ n 2- 2 vs. Welch’s approximation).”
Paired (dependent) samples: “When are paired-sample tests appropriate? Explain how to form the differences Dᵢ=X₁ i- X₂ i , define D overbar and SD , and describe the paired t test statistic tₛ T A T=(D overbar- muD/ₛD÷√(n)) and its degrees of freedom n- 1 .”
Comparing two proportions: “Explain how to compare two population proportions using a two-sample proportion test. Discuss the normality criteria (e.g., n 1 ModifyingAbove p caret₁ greater than or=10 , n 1 (1- ModifyingAbove p caret₁) greater than or=10 , etc.), define the pooled proportion ModifyingAbove p caret=(X 1+ X 2/n 1+ n 2) , and interpret the Z test statistic for ModifyingAbove p caret₁- ModifyingAbove p caret₂ .”
Comparing two variances (F test): “Describe the F test for equality of variances, including the hypotheses H 0 colon Σ 1 squared=Σ 2 squared , the test statistic Fₛ T A T=(S 1 squared/S 2 squared) , and the degrees of freedom d f 1=n 1- 1 , d f 2=n 2- 1 . Explain what evidence would lead you to doubt equal variances.”
Confidence intervals connection: “Explain how confidence intervals relate to two-sample testing for (a) means and (b) proportions. In your answer, state the general CI forms from the notes and how they help assess plausible values of the difference between populations.”
