 뒤로
뒤로Chapter 1: Graphs, Functions, and Models – Foundations of Graphing in College Algebra
스터디 가이드 - 스마트 노트
 자료에 맞춘 맞춤형 노트, 핵심 정의, 예시, 맥락을 확장해 제공합니다.
Graphs, Functions, and Models
Introduction to Graphing and Coordinate Systems
Understanding graphs and coordinate systems is fundamental in College Algebra, as they provide the framework for visualizing and analyzing mathematical relationships. In real-world applications, such as Geographic Information Systems (GIS) and Global Positioning Systems (GPS), coordinate systems are essential for defining locations and mapping data.
Global or Spherical Coordinate System: Uses latitude and longitude to specify positions on the Earth's surface.
Projected Coordinate System: Projects the Earth's spherical surface onto a two-dimensional Cartesian coordinate plane, commonly used in map projections.
Both systems are crucial for translating real-world locations into mathematical models.
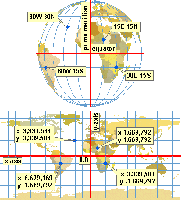
Additional info: The image above visually demonstrates the transformation from a spherical (global) coordinate system to a projected (Cartesian) coordinate system, which is foundational for graphing in algebra and GIS applications.
The Rectangular (Cartesian) Coordinate System
The rectangular coordinate system, also known as the Cartesian plane, is the basis for most graphing in algebra. It consists of two perpendicular number lines: the horizontal x-axis and the vertical y-axis. The intersection of these axes is called the origin (0, 0).
Each point in the plane is represented by an ordered pair (x, y).
The plane is divided into four quadrants.
Graphing Ordered Pairs and Linear Equations
Plotting ordered pairs on the Cartesian plane allows us to visualize solutions to equations. When multiple points satisfy a linear equation, they form a straight line.
Ordered Pair: A pair of numbers (x, y) that represent a point's location.
Linear Equation: An equation whose graph is a straight line, typically written as .
To graph a linear equation, plot several ordered pairs that satisfy the equation and connect them.
Example: Graph the equation by choosing values for x, calculating corresponding y-values, and plotting the points.
Graphing Linear Equations Using an X-Y Table
An effective method for graphing linear equations is to use an x-y table:
Choose several values for x.
Substitute each x-value into the equation to find the corresponding y-value.
Plot the resulting (x, y) pairs on the coordinate plane and connect them to form a line.
Example: For , if x = 0, then y = 3; if x = 1, then y = 2; if x = -1, then y = 4.
Graphing Using Slope and Y-Intercept
Another common method for graphing a linear equation is to use the slope-intercept form:
Slope-Intercept Form: , where m is the slope and b is the y-intercept.
Start by plotting the y-intercept (0, b).
Use the slope (rise over run) to find additional points.
Example: For , plot (0, -1), then from there move up 2 units and right 1 unit to plot the next point.
X-Intercepts and Y-Intercepts
The intercepts of a graph are where it crosses the axes:
X-Intercept: The point where the graph crosses the x-axis (y = 0).
Y-Intercept: The point where the graph crosses the y-axis (x = 0).
Finding Intercepts Algebraically:
To find the x-intercept, set y = 0 and solve for x.
To find the y-intercept, set x = 0 and solve for y.
Example: For , the y-intercept is (0, -6), and the x-intercept is found by solving (so (2, 0)).
Distance and Midpoint Formulas
These formulas are used to find the distance between two points and the midpoint of a segment connecting them.
Distance Formula:
Midpoint Formula:
Example: Find the distance between (–2, –1) and (6, 7):
Example: Find the midpoint between (1, 2) and (7, –5):
Equation of a Circle
A circle is the set of all points in a plane that are equidistant from a fixed point called the center. The distance from the center to any point on the circle is the radius.
Standard Form of the Equation of a Circle:
Where (h, k) is the center and r is the radius.
Example 1: Write the equation of a circle with center (0, –6) and radius 10:
Example 2: Find the equation of the circle with diameter endpoints (–2, 3) and (–1, 1):
First, find the center (midpoint):
Find the radius (half the distance between endpoints):
Equation:
Summary Table: Key Formulas
Concept | Formula | Description |
|---|---|---|
Distance between points | Distance between (x1, y1) and (x2, y2) | |
Midpoint | Midpoint of segment joining (x1, y1) and (x2, y2) | |
Equation of a circle | Circle with center (h, k) and radius r | |
Slope-intercept form | Line with slope m and y-intercept b |
Additional info: These foundational concepts and formulas are essential for success in College Algebra and for understanding more advanced topics in mathematics and applied sciences.
