 뒤로
뒤로College Algebra Chapter 3: Quadratic, Piecewise-Defined, and Power Functions
스터디 가이드 - 스마트 노트
 자료에 맞춘 맞춤형 노트, 핵심 정의, 예시, 맥락을 확장해 제공합니다.
Quadratic Functions and Their Properties
Definition and General Form
A quadratic function is a function of the form , where . Quadratic functions graph as parabolas, which may open upward or downward depending on the sign of .
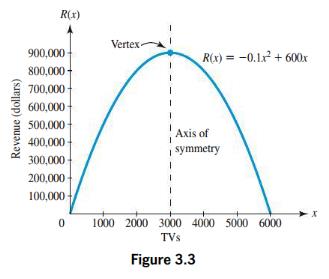
Vertex: The highest or lowest point on the parabola, given by .
Axis of Symmetry: The vertical line that divides the parabola into two symmetric halves.
Maximum/Minimum: If , the vertex is a minimum; if , the vertex is a maximum.
Example: The function models monthly revenue from TV sales. The vertex represents the maximum revenue achievable.
Vertex Form
The vertex form of a quadratic function is , where is the vertex.
Allows easy identification of the vertex and direction of opening.
Useful for graphing and interpreting applications.
Solving Quadratic Equations
Factoring and Zero Product Property
Quadratic equations can often be solved by factoring and applying the zero product property: If , then or .
Set the equation to zero and factor.
Solve each factor for .
Quadratic Formula
The quadratic formula solves any quadratic equation :
The expression under the square root, , is called the discriminant.
If , there are two real solutions; if , one real solution; if , two complex solutions.
Complex Numbers
Definition and Classification
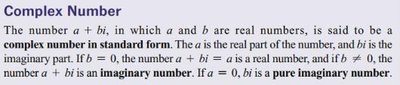
A complex number is of the form , where and are real numbers and is the imaginary unit ().
Standard form:
Real part:
Imaginary part:
If , the number is real; if , it is a pure imaginary number; if , it is an imaginary number.
Power and Root Functions
Power Functions
A power function is a function of the form , where and are real numbers and .
Examples include quadratic (), cubic (), and root functions ().
Domain and range depend on the exponent .
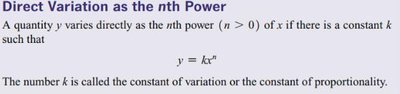
Direct Variation as the nth Power: varies directly as the th power of if , where is the constant of variation.
Applications of Power Functions
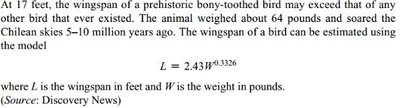
Power functions are used to model real-world phenomena, such as the wingspan of birds based on their weight:
, where is wingspan in feet and is weight in pounds.
Piecewise-Defined Functions
Definition and Examples
A piecewise-defined function is defined by different expressions for different intervals of the domain.
Useful for modeling situations with abrupt changes, such as postage rates or utility charges.
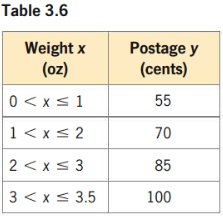
Example: Postage rates for first-class letters:
Weight x (oz) | Postage y (cents) |
|---|---|
0 < x ≤ 1 | 55 |
1 < x ≤ 2 | 70 |
2 < x ≤ 3 | 85 |
3 < x ≤ 3.5 | 100 |
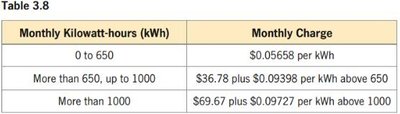
Example: Residential electricity charges:
Monthly Kilowatt-hours (kWh) | Monthly Charge |
|---|---|
0 to 650 | $0.05658 per kWh |
More than 650, up to 1000 | $36.78 plus $0.09398 per kWh above 650 |
More than 1000 | $69.67 plus $0.09727 per kWh above 1000 |
Modeling Data with Quadratic and Power Functions
Quadratic Models
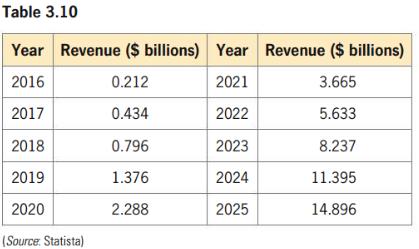
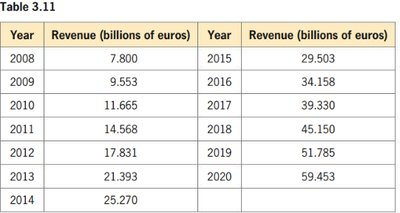
Quadratic functions can be used to fit data points and model real-world scenarios, such as enterprise AI revenue or cloud computing revenue.
Year | Revenue ($ billions) |
|---|---|
2016 | 0.212 |
2017 | 0.434 |
2018 | 0.796 |
2019 | 1.376 |
2020 | 2.288 |
2021 | 3.665 |
2022 | 5.633 |
2023 | 8.237 |
2024 | 11.395 |
2025 | 14.896 |
Year | Revenue (billions of euros) |
|---|---|
2008 | 7.800 |
2009 | 9.553 |
2010 | 11.665 |
2011 | 14.568 |
2012 | 17.831 |
2013 | 21.393 |
2014 | 25.270 |
2015 | 29.503 |
2016 | 34.158 |
2017 | 39.330 |
2018 | 45.150 |
2019 | 51.785 |
2020 | 59.453 |
Power Models
Power functions are also used to model data, such as the percent of U.S. adults with diabetes or the number of female physicians.
Year | Percent |
|---|---|
2010 | 15.7 |
2015 | 18.9 |
2020 | 21.1 |
2025 | 24.2 |
2030 | 27.2 |
2035 | 29.0 |
2040 | 31.4 |
2045 | 32.1 |
2050 | 34.3 |
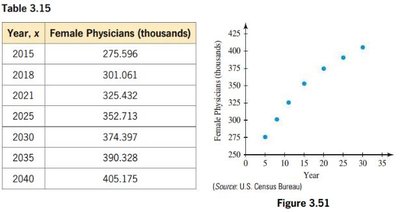
Year, x | Female Physicians (thousands) |
|---|---|
2015 | 275.596 |
2018 | 301.061 |
2021 | 325.432 |
2025 | 352.713 |
2030 | 374.397 |
2035 | 390.328 |
2040 | 405.175 |
Purchasing Power Models
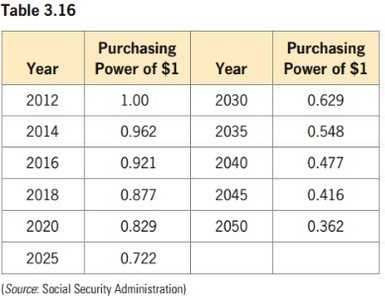
Quadratic and power functions can model the purchasing power of a dollar over time.
Year | Purchasing Power of $1 |
|---|---|
2012 | 1.00 |
2014 | 0.962 |
2016 | 0.921 |
2018 | 0.877 |
2020 | 0.829 |
2025 | 0.722 |
2030 | 0.629 |
2035 | 0.548 |
2040 | 0.477 |
2045 | 0.416 |
2050 | 0.362 |
Additional info:
Graphs and scatter plots are essential for visualizing quadratic and power models.
Piecewise-defined functions are commonly used in real-world pricing and rate structures.
Complex numbers are fundamental for solving quadratic equations with negative discriminants.
