 뒤로
College Algebra: Structured Study Notes and Visuals
스터디 가이드 - 스마트 노트
 자료에 맞춘 맞춤형 노트, 핵심 정의, 예시, 맥락을 확장해 제공합니다.
Ch. R - Review of Basic Concepts
Complex Numbers and Their Classification
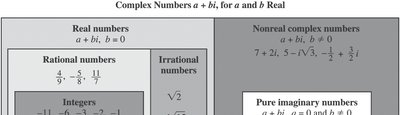
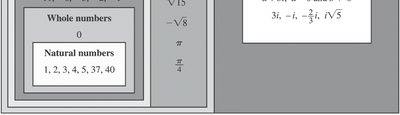
Complex numbers are numbers of the form a + bi, where a and b are real numbers and i is the imaginary unit defined by i^2 = -1. The classification of numbers includes real numbers (rational and irrational), integers, whole numbers, and natural numbers, as well as nonreal complex numbers and pure imaginary numbers.
Rational numbers: Numbers that can be expressed as a fraction of two integers.
Irrational numbers: Numbers that cannot be written as a simple fraction (e.g., √2, π).
Pure imaginary numbers: Numbers of the form bi where b ≠ 0.
Nonreal complex numbers: Numbers where b ≠ 0 in a + bi.
Ch. 1 - Equations and Inequalities
Applications and Modeling with Linear Equations
Linear equations are used to model real-world problems, including geometry and motion. The process involves translating a word problem into an algebraic equation, solving for the unknown, and interpreting the result.
Geometry problems: Often involve finding dimensions or areas using algebraic expressions.
Motion problems: Use the formula d = rt (distance = rate × time).
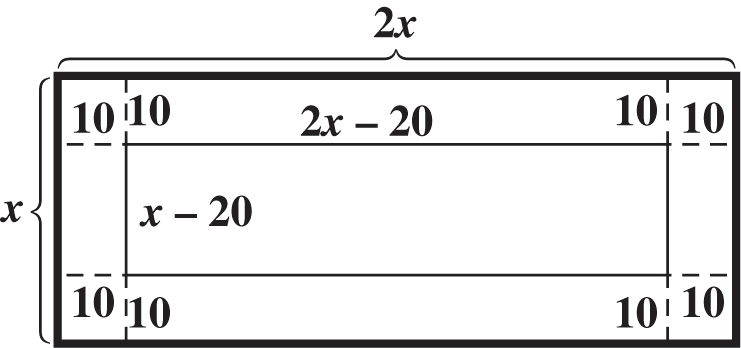
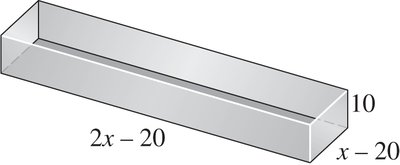
Example: Volume of an Open Box
Given a rectangular sheet with length 2x and width x, squares of side 10 cm are cut from each corner to form an open box. The resulting dimensions are 2x - 20 (length), x - 20 (width), and 10 (height).
The Pythagorean Theorem
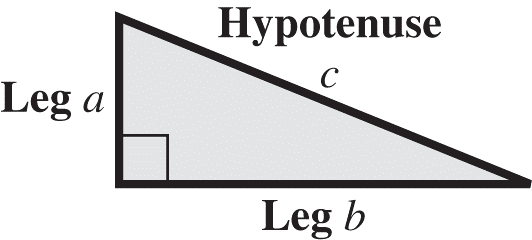
The Pythagorean Theorem states that in a right triangle, the sum of the squares of the legs equals the square of the hypotenuse: .
Legs: The two sides forming the right angle.
Hypotenuse: The side opposite the right angle.
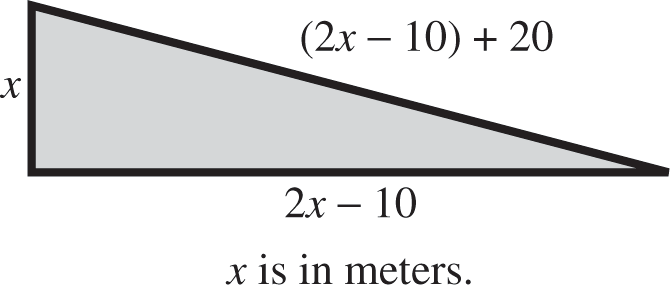
Example: Property Shaped as a Right Triangle
Given a triangle with sides expressed in terms of x, the relationships can be modeled and solved using the Pythagorean Theorem.
Ch. 2 - Graphs and Functions
Rectangular Coordinates and Ordered Pairs
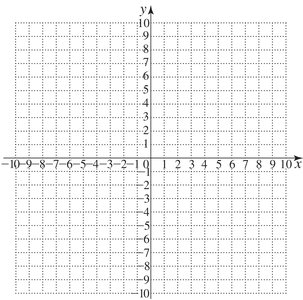
The rectangular (Cartesian) coordinate system is used to plot points and visualize relationships between variables. Ordered pairs (x, y) represent points in the plane.
Origin: The point (0, 0).
Quadrants: The plane is divided into four regions by the x- and y-axes.
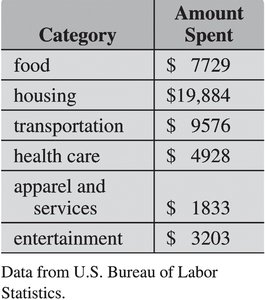
Example: Spending Categories Table
Tabular data can be represented as ordered pairs for plotting or analysis.
Graphing Equations by Point Plotting
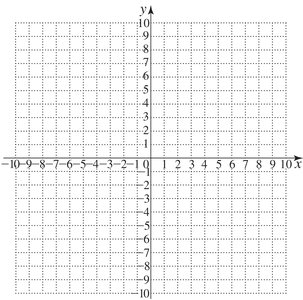
To graph an equation, find intercepts and additional points, plot them, and connect with a smooth curve.
x-intercept: Where the graph crosses the x-axis.
y-intercept: Where the graph crosses the y-axis.
Ch. 6 - Analytic Geometry
Summary of Key Geometric Figures
Analytic geometry studies geometric figures using algebraic equations. Key figures include rectangles, triangles, and boxes, often modeled with variables.
Rectangles: Used in area and perimeter problems.
Triangles: Used in problems involving the Pythagorean Theorem.
Additional info:
The images included are directly relevant to the explanation of geometric modeling, coordinate systems, and the classification of numbers. All images are used only where they visually clarify the adjacent paragraph.
