 뒤로
뒤로Graphing Linear Equations and Identifying Intercepts
스터디 가이드 - 스마트 노트
 자료에 맞춘 맞춤형 노트, 핵심 정의, 예시, 맥락을 확장해 제공합니다.
Linear Equations and Inequalities in Two Variables
Introduction to Linear Equations in Two Variables
Linear equations in two variables are equations that can be written in the standard form Ax + By = C, where A, B, and C are real numbers and A and B are not both zero. The graph of such an equation is always a straight line. Understanding how to graph these equations and identify their intercepts is fundamental in College Algebra.
Graphing Linear Equations Using Intercepts
One of the most efficient ways to graph a linear equation is by finding its intercepts. The intercepts are the points where the graph crosses the x-axis and y-axis.
x-intercept
The x-intercept is the x-coordinate of the point where the graph crosses the x-axis.
At the x-intercept, the y-coordinate is always zero.
To find the x-intercept, set y = 0 in the equation and solve for x.
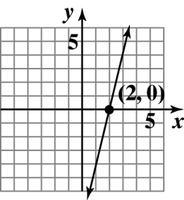
Example: The graph crosses the x-axis at (2, 0). The x-intercept is 2.
y-intercept
The y-intercept is the y-coordinate of the point where the graph crosses the y-axis.
At the y-intercept, the x-coordinate is always zero.
To find the y-intercept, set x = 0 in the equation and solve for y.
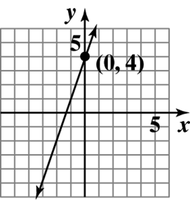
Example: The graph crosses the y-axis at (0, 4). The y-intercept is 4.
Identifying Intercepts from a Graph
To identify intercepts from a graph, locate the points where the line crosses the axes.
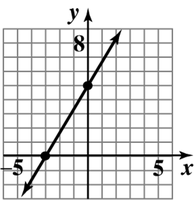
Example 1a: The graph crosses the x-axis at (–3, 0) and the y-axis at (0, 5). Thus, the x-intercept is –3 and the y-intercept is 5.
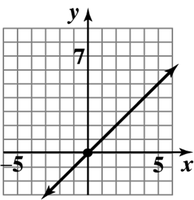
Example 1b: The graph crosses both axes at (0, 0). Thus, both the x-intercept and y-intercept are 0.
Finding Intercepts Algebraically
To find the x-intercept of an equation such as , set y = 0 and solve for x:
The x-intercept is 3, so the graph passes through (3, 0).
To find the y-intercept, set x = 0 and solve for y:
The y-intercept is –4, so the graph passes through (0, –4).
Steps for Graphing Ax + By = C Using Intercepts
Find the x-intercept (let y = 0 and solve for x).
Find the y-intercept (let x = 0 and solve for y).
Find a checkpoint (a third ordered-pair solution).
Draw a line through the three points to graph the equation.
Example: Graphing a Linear Equation Using Intercepts
Graph .
Find the x-intercept: Set y = 0.
The x-intercept is 3, so the line passes through (3, 0).
Find the y-intercept: Set x = 0.
The y-intercept is 2, so the line passes through (0, 2).
Find a checkpoint: Let x = 1.
The checkpoint is (1, 4/3).
Graphing Equations of the Form Ax + By = 0
When the constant term is zero, the line passes through the origin (0, 0).
Find two additional points by choosing values for x or y and solving for the other variable.
Example: For , let y = –1, then x = 3; let y = 1, then x = –3. The points (0, 0), (3, –1), and (–3, 1) are on the line.
Graphing Horizontal and Vertical Lines
Horizontal lines have equations of the form y = k, where k is a constant. All points on the line have the same y-value.
Vertical lines have equations of the form x = h, where h is a constant. All points on the line have the same x-value.
Example: The line y = 3 is horizontal and passes through all points with y = 3. The line x = –2 is vertical and passes through all points with x = –2.
