 뒤로
뒤로Graphs and Properties of Functions in College Algebra
스터디 가이드 - 스마트 노트
 자료에 맞춘 맞춤형 노트, 핵심 정의, 예시, 맥락을 확장해 제공합니다.
Graphs of Functions
Introduction to Function Graphs
Functions can be represented visually using graphs, which show the relationship between input values (x) and output values (f(x) or y). Common functions include linear, quadratic, absolute value, cubic, square root, and reciprocal functions. Each has a characteristic graph that helps in understanding its behavior.
Linear function: (straight line)
Quadratic function: (parabola)
Absolute value function: (V-shaped graph)
Cubic function: (S-shaped curve)
Square root function: (half-parabola, rightward)
Reciprocal function: (hyperbola)
Vertical Line Test
Determining if a Graph Represents a Function
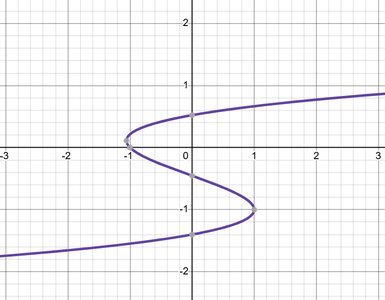
Not every graph represents a function. The Vertical Line Test is a visual way to determine if a graph defines y as a function of x. If any vertical line intersects the graph at more than one point, the graph does not represent a function.
Key Point: Each input (x) must correspond to exactly one output (y).
Application: Use the test to quickly check if a relation is a function.
Domain and Range
Understanding Inputs and Outputs
The domain of a function is the set of all possible input values (x) for which the function is defined. The range is the set of all possible output values (f(x)).
Domain: All valid x values.
Range: All resulting f(x) values.
Example: For , the domain is and the range is .
Intercepts
Finding Where the Graph Crosses the Axes
Intercepts are points where the graph crosses the axes:
x-intercept: Set and solve for .
y-intercept: Set and solve for .
Example: For , the x-intercepts are and ; the y-intercept is .
Increasing and Decreasing Functions
Behavior of Functions on Intervals
A function is increasing on an interval if, as x increases, f(x) also increases. It is decreasing if, as x increases, f(x) decreases. These behaviors are important for understanding the overall shape of a graph.
Increasing: For any , .
Decreasing: For any , .
Constant: For any , .
Maxima and Minima
Relative (Local) Maximum and Minimum Values
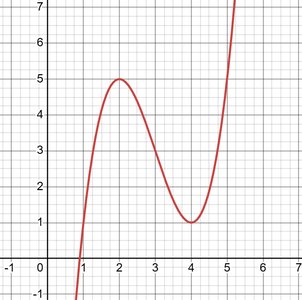
The points where a function changes from increasing to decreasing (or vice versa) are called relative maxima or relative minima. These are also known as local maxima and local minima.
Relative Maximum: is a relative maximum if there exists an open interval containing such that for all in the interval.
Relative Minimum: is a relative minimum if there exists an open interval containing such that for all in the interval.
Application: Used to identify peaks and valleys in graphs.
Symmetry
Types of Symmetry in Graphs
Graphs can exhibit different types of symmetry, which can be tested algebraically:
y-axis symmetry: If replacing with yields an equivalent equation, the graph is symmetric about the y-axis.
x-axis symmetry: If replacing with yields an equivalent equation, the graph is symmetric about the x-axis.
Origin symmetry: If replacing with and with yields an equivalent equation, the graph is symmetric about the origin.
Example: is symmetric about the y-axis; is symmetric about the origin.
Even and Odd Functions
Classification Based on Symmetry
Functions can be classified as even, odd, or neither based on their symmetry properties:
Even function: for all in the domain (symmetric about the y-axis).
Odd function: for all in the domain (symmetric about the origin).
Neither: If neither condition holds.
Example: is even; is odd; is neither.
Piecewise Functions
Functions Defined by Multiple Rules
A piecewise function is defined by different expressions over different parts of its domain. Each "piece" applies to a specific interval of the input values.
Example:
To evaluate: Choose the rule that matches the input value's interval.
Application: Used to model situations with different behaviors in different ranges.
Difference Quotients
Average Rate of Change
The difference quotient measures the average rate of change of a function over an interval. It is foundational for calculus but also useful in algebra for understanding how functions change.
Formula: , where .
Example: For , the difference quotient is .
