 뒤로
뒤로Linear and Quadratic Functions: Properties, Models, and Applications
스터디 가이드 - 스마트 노트
 자료에 맞춘 맞춤형 노트, 핵심 정의, 예시, 맥락을 확장해 제공합니다.
Linear Functions and Linear Models
Definition and Properties of Linear Functions
A linear function is a function of the form , where m is the slope and b is the y-intercept. The graph of a linear function is a straight line. The domain of a linear function is all real numbers, .
Slope (m): Measures the steepness of the line; calculated as the change in y over the change in x.
Y-intercept (b): The value of y when x = 0.
Domain: All real numbers unless otherwise restricted by context.
Example: Graphing a Linear Function
Consider . The slope is -3 and the y-intercept is 7. The domain is all real numbers. The range is also all real numbers.
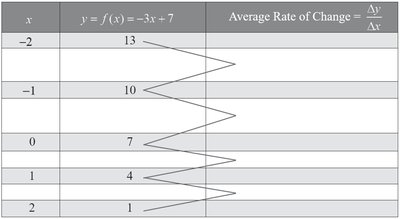
Average Rate of Change and Linearity
The average rate of change of a function between two points and is given by:
For a linear function, the average rate of change is constant and equals the slope m.
Increasing, Decreasing, and Constant Linear Functions
A linear function is increasing if .
It is decreasing if .
It is constant if .
Finding the Zero of a Linear Function
The zero of a linear function is the value of x for which :
Building Linear Models from Verbal Descriptions
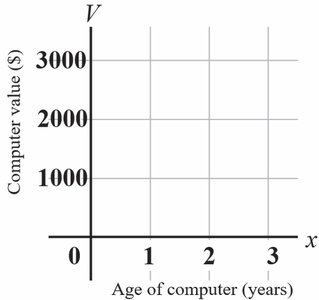
If the average rate of change is constant, a linear model can be used. For example, in straight-line depreciation, the value of an asset decreases by a fixed amount each year.
Model: , where is the initial value and is the annual depreciation.
Supply and Demand: Linear Models in Economics
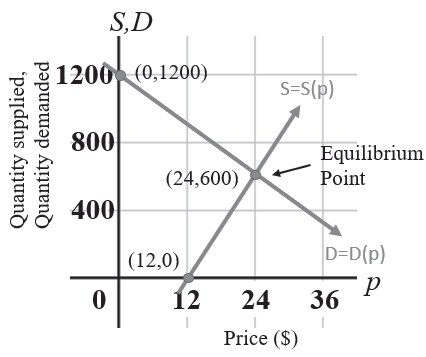
Supply and demand can be modeled with linear equations. The equilibrium point is where quantity supplied equals quantity demanded.
Equilibrium:
Building Linear Models from Data
Scatter Plots and Interpretation
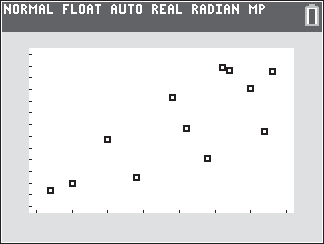
A scatter plot is a graph of ordered pairs used to visualize the relationship between two variables. It helps determine if a linear model is appropriate.
Finding a Model for Linearly Related Data
To model data with a line:
Plot the data as a scatter plot.
Select two points and find the equation of the line through them.
Graph the line on the scatter plot to check fit.
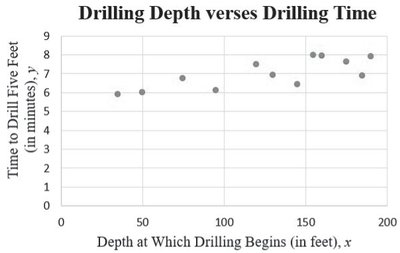
Line of Best Fit and Correlation Coefficient
The line of best fit (least squares regression line) minimizes the sum of squared differences between observed and predicted values. The correlation coefficient measures the strength and direction of the linear relationship:
close to 1: strong linear relationship
close to 0: weak or no linear relationship
Quadratic Functions and Their Zeros
Definition and Properties of Quadratic Functions
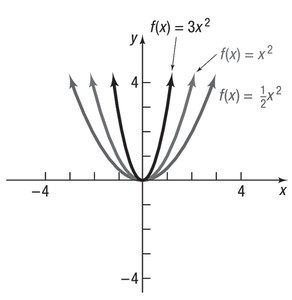
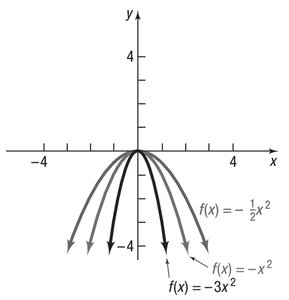
A quadratic function is of the form , where . The graph is a parabola. The domain is all real numbers.
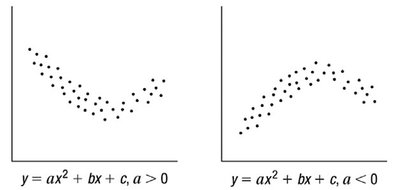
If , the parabola opens upward (concave up).
If , the parabola opens downward (concave down).
Finding Zeros of Quadratic Functions
Factoring: Set and factor the quadratic expression.
Square Root Method: Used when the equation is in the form .
Completing the Square: Rewrite in the form .
Quadratic Formula: For :
The discriminant determines the number and type of solutions:
: Two distinct real solutions
: One real solution (double root)
: No real solutions
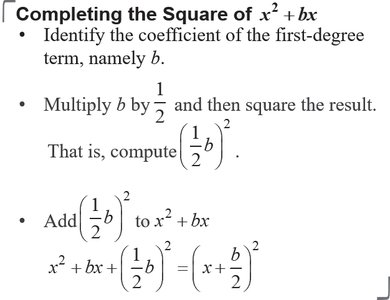
Completing the Square
To complete the square for :
Multiply by and square the result:
Add to to form a perfect square trinomial.
Properties and Graphs of Quadratic Functions
Standard and Vertex Form
Standard form:
Vertex form: , where is the vertex.
The vertex is the highest or lowest point of the parabola. The axis of symmetry is the vertical line .
Graphing Quadratic Functions Using Transformations
To graph :
Identify the vertex .
Determine if the parabola opens up () or down ().
Find the axis of symmetry .
Find the y-intercept () and x-intercepts (solve ).
Applications: Revenue and Optimization
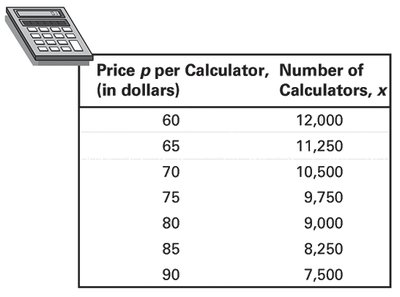
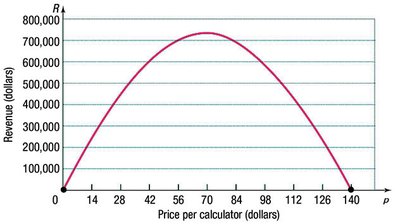
Quadratic functions are used in optimization problems, such as maximizing revenue or area. The maximum or minimum value occurs at the vertex.
Fitting Quadratic Models to Data
When data follows a parabolic trend, a quadratic model can be fitted using regression techniques. The model can be used to predict maximum or minimum values and interpret real-world phenomena.
Summary Table: Linear vs. Quadratic Models
Property | Linear Function | Quadratic Function |
|---|---|---|
General Form | ||
Graph | Straight line | Parabola |
Average Rate of Change | Constant | Variable |
Vertex | None | |
Applications | Depreciation, supply/demand | Revenue, area, projectile motion |
Additional info: This guide covers the foundational concepts of linear and quadratic functions, their properties, methods for finding zeros, and applications in modeling real-world scenarios. It also introduces the use of scatter plots and regression for fitting models to data, which is essential for interpreting and predicting outcomes in various fields.
