 뒤로
뒤로Types of Functions and Their Rates of Change: College Algebra Study Guide
스터디 가이드 - 스마트 노트
 자료에 맞춘 맞춤형 노트, 핵심 정의, 예시, 맥락을 확장해 제공합니다.
Types of Functions and Their Rates of Change
Linear Functions
Linear functions are fundamental in algebra and are characterized by a constant rate of change. They are represented by the equation , where m is the slope and b is the y-intercept.
Definition: A linear function is any function of the form .
Graph: The graph of a linear function is always a straight line.
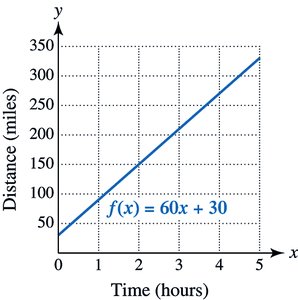
Example: A car traveling north at 60 miles per hour, starting 30 miles north of the Texas border, is modeled by .
Rate of Change and Slope
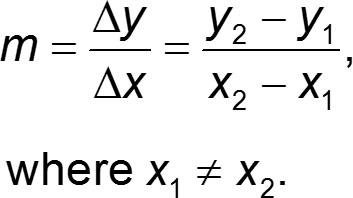
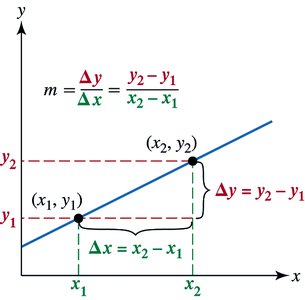
The rate of change in a linear function is constant and is equal to the slope of the line. The slope measures how much the function's output changes for each unit increase in the input.
Formula: The slope between two points and is given by:
Interpretation: If , the function increases; if , it decreases; if , the function is constant.
Types of Slope
The slope of a line can be positive, negative, zero, or undefined, each with distinct graphical characteristics.
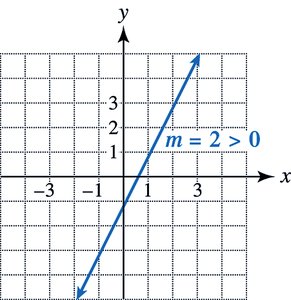
Positive Slope: The line rises from left to right. Example: .
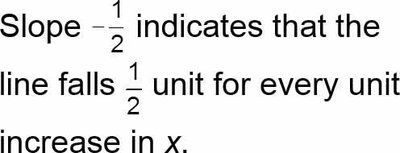
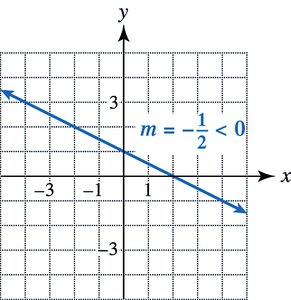
Negative Slope: The line falls from left to right. Example: .
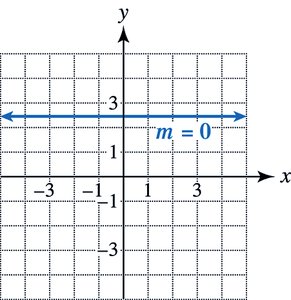
Zero Slope: The line is horizontal.
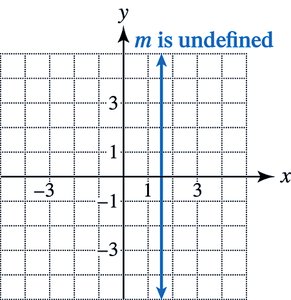
Undefined Slope: The line is vertical.
Calculating Slope from Two Points
To find the slope of a line given two points, use the slope formula. The sign and value of the slope indicate the direction and steepness of the line.
Example: Find the slope between and :
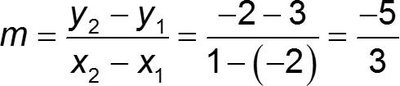

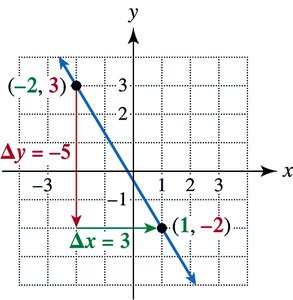
Interpretation: The slope means the line falls $5 units increase in .
Zero of a Function
A zero of a function is a value such that . This is where the graph crosses the x-axis.
Definition: Any number for which is called a zero of the function .
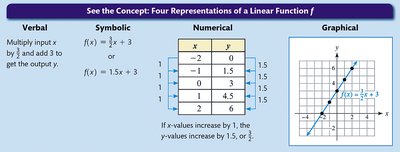
Four Representations of a Linear Function
Linear functions can be represented in four ways: verbal, symbolic, numerical, and graphical. Understanding all forms is essential for interpreting and solving algebraic problems.
Verbal: Describes the relationship in words.
Symbolic: Uses equations, e.g., .
Numerical: Shows input-output pairs in a table.
Graphical: Plots the function on a coordinate plane.
Characteristics of Linear Functions
Linear functions have several defining properties:
Graph is a straight line.
Can be written as .
Has a constant rate of change, equal to .
Has exactly one zero if .
Nonlinear Functions
Definition and Characteristics
Nonlinear functions do not have a constant rate of change and their graphs are not straight lines. They can have any number of zeros and cannot be written in the form .
Graph is not a straight line.
Rate of change is not constant.
Can have multiple zeros.
Common Nonlinear Functions
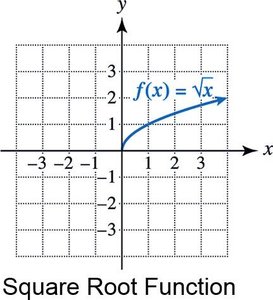
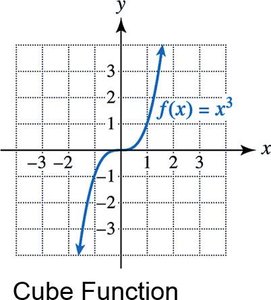
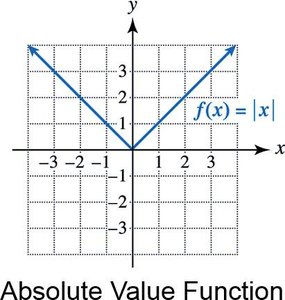
Examples of nonlinear functions include quadratic, square root, cubic, and absolute value functions.
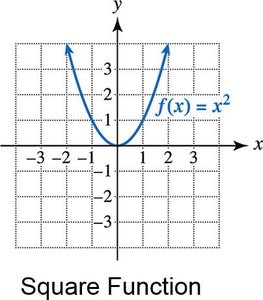
Square Function:
Square Root Function:
Cube Function:
Absolute Value Function:
Increasing and Decreasing Functions
Definitions
A function is said to be increasing on an interval if its output rises as the input increases, and decreasing if its output falls as the input increases.
Increasing: For , .
Decreasing: For , .
Examples and Applications
Graphs can illustrate where functions are increasing or decreasing. Interval notation is used to specify these regions.
Example: The function is decreasing on and increasing on .
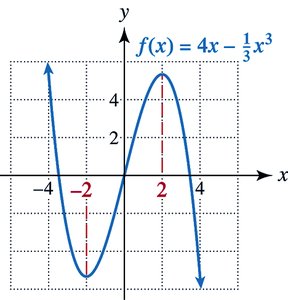
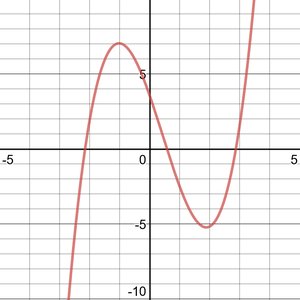
Visualizing Increasing and Decreasing Functions
Graphs and real-world examples, such as sales data, can help visualize these concepts.
Example: Rock music sales decreased from 1990 to 2001 and increased from 2001 to 2006.
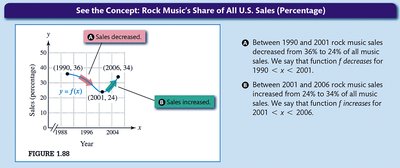
General Illustration: Graphs show uphill (increasing), downhill (decreasing), and mixed behavior.
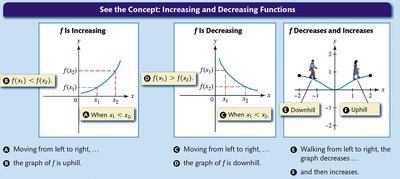
Additional info: All explanations are expanded for clarity and completeness, suitable for college-level algebra study.
