 뒤로
Chapter 5: Thermochemistry – Study Notes for General Chemistry
스터디 가이드 - 스마트 노트
 자료에 맞춘 맞춤형 노트, 핵심 정의, 예시, 맥락을 확장해 제공합니다.
Thermochemistry
Introduction to Energy and Thermochemistry
Thermochemistry is a branch of thermodynamics that focuses on the study of energy changes, particularly heat, during chemical reactions. Energy is defined as the ability to do work or transfer heat, and it is a central concept in understanding chemical processes.
Energy: The capacity to do work or transfer heat.
Thermodynamics: The study of energy and its transformations.
Thermochemistry: The study of chemical reactions and the energy changes involving heat.

Chemical Energy and Potential Energy
Chemical energy in molecules is primarily potential energy, especially electrostatic potential energy, which arises from interactions between charged particles.
Electrostatic Potential Energy (Eel): Energy due to the attraction or repulsion between charged particles.
Joule (J): The SI unit of energy.
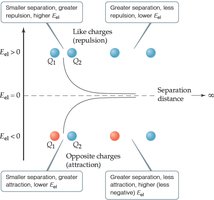
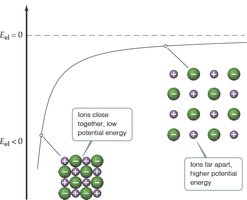
Attraction Between Ions
Electrostatic attraction occurs between oppositely charged ions, leading to the release of energy when chemical bonds are formed and the consumption of energy when bonds are broken.
Energy is released during bond formation.
Energy is consumed during bond breaking.
First Law of Thermodynamics
Law of Conservation of Energy
The first law states that energy can be converted from one form to another, but it cannot be created or destroyed. This principle is fundamental in all energy transformations, including chemical reactions.
Examples: Chemical energy to heat (heating homes), sunlight to chemical energy (photosynthesis).
System and Surroundings
In thermochemistry, the universe is divided into the system (the part under study) and the surroundings (everything else).
System: The specific part of the universe being studied (e.g., reactants in a reaction).
Surroundings: Everything outside the system.
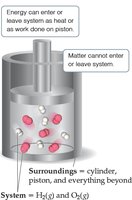
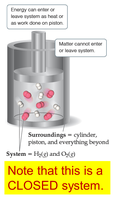
Types of Systems
Systems are classified based on their ability to exchange energy and matter with their surroundings.
Open System: Exchanges both energy and matter.
Closed System: Exchanges energy but not matter.
Isolated System: Exchanges neither energy nor matter.
Internal Energy and Its Changes
Definition of Internal Energy
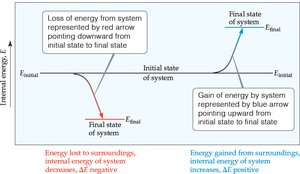
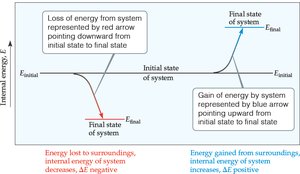
The internal energy (E) of a system is the sum of all kinetic and potential energies of its components. While the absolute value of E is unknown, changes in E can be measured.
Internal Energy (E): Total energy content of a system.
Only changes in internal energy (ΔE) are measurable.
Change in Internal Energy
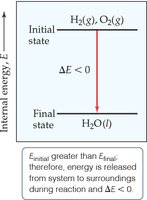
The change in internal energy is calculated as the difference between the final and initial energies of the system.
Formula:
Energy Exchange: Heat and Work
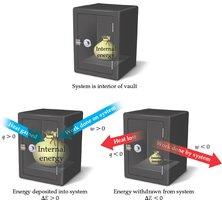
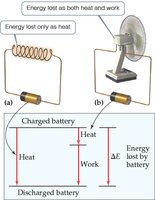
Energy exchange between the system and surroundings occurs as heat (q) or work (w).
Formula:
Heat (q): Energy transferred due to temperature difference.
Work (w): Energy transferred when an object is moved by a force.
Sign Conventions for ΔE, q, and w
The sign of thermodynamic quantities indicates the direction of energy flow.
Positive: System gains energy.
Negative: System loses energy.
Endothermic and Exothermic Processes
Endothermic Processes
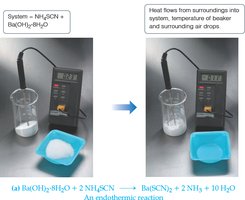
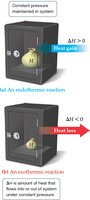
When heat is absorbed by the system from the surroundings, the process is endothermic.
ΔH > 0 (heat gained)
Example: Dissolving ammonium nitrate in water.
Exothermic Processes
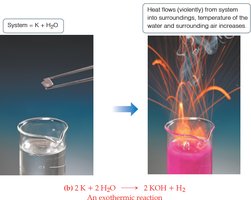
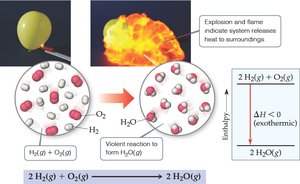
When heat is released by the system into the surroundings, the process is exothermic.
ΔH < 0 (heat lost)
Example: Combustion of hydrogen.
State Functions
Definition and Properties
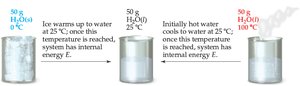
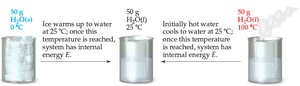
A state function depends only on the current state of the system, not on the path taken to reach that state. Internal energy (E) and enthalpy (H) are state functions, while heat (q) and work (w) are not.
Examples: Internal energy, enthalpy.
Non-state functions: Heat, work.
Work in Thermochemistry
Pressure-Volume Work
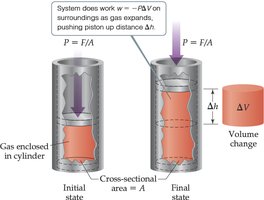
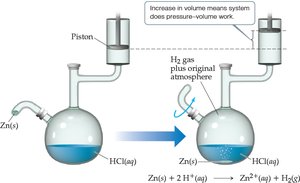
Mechanical work is often associated with changes in the volume of gases. The work done by a gas expanding against a constant external pressure is given by:
Formula:
Work is negative when done by the system.
Enthalpy (H)
Definition and Calculation
Enthalpy is a thermodynamic quantity that accounts for heat flow at constant pressure. It is defined as:
Formula:
Change in enthalpy:
At constant pressure, equals the heat gained or lost.
Endothermic vs. Exothermic Reactions
Enthalpy change indicates whether a reaction is endothermic or exothermic.
Endothermic:
Exothermic:
Enthalpy of Reaction
Definition
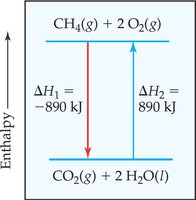
The enthalpy of reaction () is the difference between the enthalpy of products and reactants.
Formula:
Properties of Enthalpy
Enthalpy is an extensive property (depends on the amount of substance).
Enthalpy change for a reaction is equal in magnitude but opposite in sign for the reverse reaction.
Enthalpy change depends on the states of reactants and products.
Calorimetry
Measurement of Heat Flow
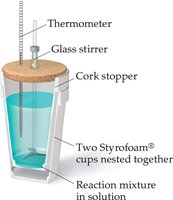
Calorimetry is the technique used to measure heat flow during chemical reactions. The device used is called a calorimeter.
Calorimeter: Instrument for measuring heat flow.
Heat Capacity and Specific Heat
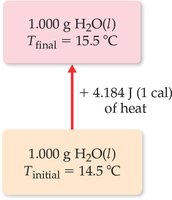
Heat capacity is the energy required to raise the temperature of a substance by 1 K. Specific heat is the heat capacity per gram, and molar heat capacity is per mole.
Specific heat of water: 4.184 J/g·K
Formula:
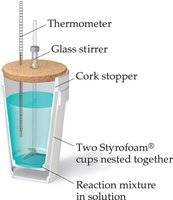
Constant Pressure Calorimetry
Reactions in aqueous solution are often studied using constant pressure calorimetry, where the heat change for the system is determined by measuring the heat change for water.
Formula:
Bomb Calorimetry
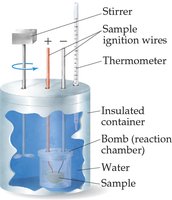
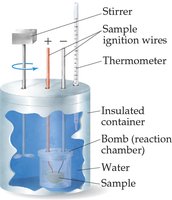
Bomb calorimetry is used for reactions carried out at constant volume. The heat absorbed or released by water approximates the enthalpy change for the reaction.
Measures change in internal energy () at constant volume.
Hess’s Law
Calculation of Enthalpy Changes
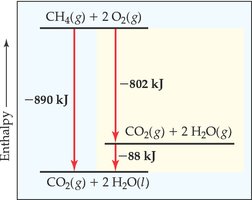
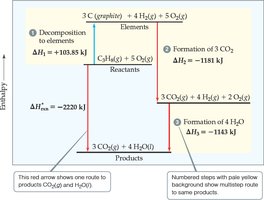
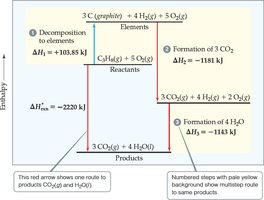
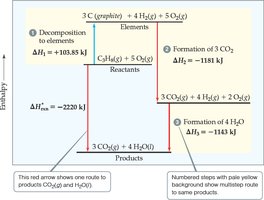
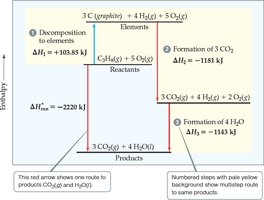
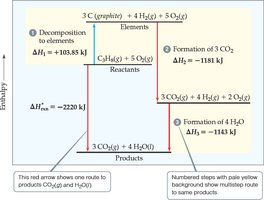
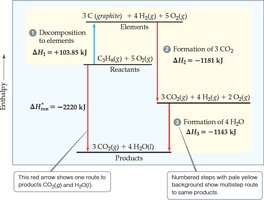
Hess’s Law states that if a reaction is carried out in a series of steps, the overall enthalpy change is the sum of the enthalpy changes for the individual steps. This is possible because enthalpy is a state function.
Formula:
Enthalpies of Formation
Standard Enthalpies of Formation
The standard enthalpy of formation () is the enthalpy change for the formation of one mole of a compound from its elements in their standard states at 25°C and 1 atm.
Used to calculate enthalpy changes for reactions.
Calculation of ΔH Using Standard Enthalpy Values
Stepwise Calculation Example
Enthalpy changes can be calculated by breaking down reactions into steps and using standard enthalpy values.
Apply Hess’s Law and use stoichiometric coefficients.
Bond Enthalpy
Definition and Application
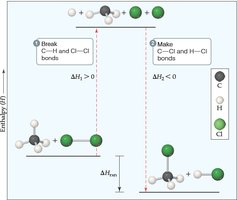
Bond enthalpy is the energy required to break one mole of a specific bond in a gaseous substance. It is always positive, as energy is needed to break bonds, and energy is released when bonds form.
Greater bond enthalpy means stronger bond.


Bond Enthalpy and Enthalpy of Reaction
Enthalpy of reaction can be estimated by summing bond energies for bonds broken and formed.
Add bond energies for bonds formed (+).
Subtract bond energies for bonds broken (−).
Formula:
Energy in Foods and Fuels
Energy in Foods
The energy released when one gram of food is combusted is its fuel value. Most energy in foods comes from carbohydrates, fats, and proteins.
Carbohydrates: 17 kJ/g
Fats: 38 kJ/g
Proteins: 17 kJ/g
Energy in Fuels
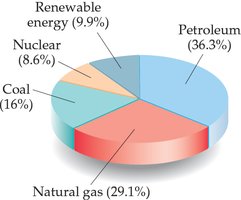
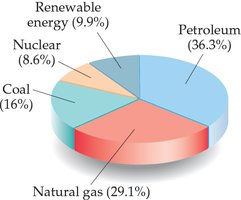
Fossil fuels provide the majority of energy consumed, with contributions from coal, petroleum, natural gas, nuclear, and renewable sources.
Petroleum, coal, and natural gas are primary sources.
Nuclear and renewable energy are also significant.
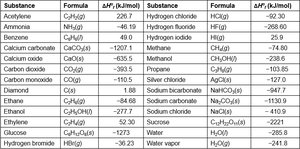
Summary Table: Standard Enthalpies of Formation
The following table summarizes standard enthalpies of formation for common substances:
Substance | Formula | ΔHf° (kJ/mol) | Substance | Formula | ΔHf° (kJ/mol) |
|---|---|---|---|---|---|
Acetylene | C2H2(g) | 226.7 | Hydrogen chloride | HCl(g) | -92.30 |
Ammonia | NH3(g) | -46.1 | Hydrogen fluoride | HF(g) | -268.6 |
Benzene | C6H6(l) | 49.0 | Hydrogen iodide | HI(g) | 26.5 |
Calcium carbonate | CaCO3(s) | -1207.1 | Methane | CH4(g) | -74.80 |
Calcium oxide | CaO(s) | -635.1 | Propane | C3H8(g) | -103.85 |
Carbon dioxide | CO2(g) | -393.5 | Silver chloride | AgCl(s) | -127.0 |
Carbon monoxide | CO(g) | -110.5 | Sodium bicarbonate | NaHCO3(s) | -947.7 |
Diamond | C(s) | 1.88 | Sodium carbonate | Na2CO3(s) | -1130.9 |
Ethane | C2H6(g) | -84.68 | Sucrose | C12H22O11(s) | -2221 |
Ethylene | C2H4(g) | 52.3 | Water | H2O(l) | -285.8 |
Glucose | C6H12O6(s) | -1273.3 | Water vapor | H2O(g) | -241.8 |
Hydrogen bromide | HBr(g) | -36.3 |
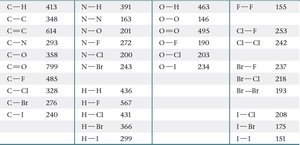
Summary Table: Average Bond Enthalpies (kJ/mol)
The following table summarizes average bond enthalpies for common bonds:
Bond | Enthalpy (kJ/mol) | Bond | Enthalpy (kJ/mol) | Bond | Enthalpy (kJ/mol) |
|---|---|---|---|---|---|
C–H | 413 | N–H | 391 | O–H | 463 |
C–C | 348 | N–N | 163 | O–O | 146 |
C=C | 614 | N=N | 418 | O=O | 495 |
C≡C | 839 | N≡N | 941 | F–F | 155 |
C–N | 293 | N–F | 272 | Cl–F | 253 |
C–O | 358 | N–Br | 243 | Cl–Cl | 242 |
C=O | 799 | O–I | 234 | Br–F | 237 |
C–F | 485 | H–F | 567 | Be–F | 218 |
C–Br | 276 | H–Cl | 431 | Be–Cl | 193 |
C–I | 240 | H–Br | 366 | I–I | 151 |
H–I | 299 |
