 뒤로
Lec 3 notes chem
스터디 가이드 - 스마트 노트
 자료에 맞춘 맞춤형 노트, 핵심 정의, 예시, 맥락을 확장해 제공합니다.
Quantum Phenomena: Evidence for the Quantization of Energy
Introduction
Early 20th-century experiments revealed that energy is not continuous, but quantized. Three key phenomena—blackbody radiation, the photoelectric effect, and atomic spectra—provided crucial evidence for the quantum nature of energy and light. These discoveries laid the foundation for quantum mechanics and revolutionized our understanding of atomic and molecular structure.
Blackbody Radiation
Definition and Significance
Blackbody radiation refers to the electromagnetic radiation emitted by an idealized object that absorbs all incident radiation (a blackbody) and re-emits energy characteristic of its temperature.
Classical physics (Rayleigh-Jeans Law) predicted that intensity would increase indefinitely at short wavelengths (the "ultraviolet catastrophe"), which was not observed experimentally.
Max Planck resolved this by proposing that energy is emitted or absorbed in discrete packets called quanta (or photons), with energy where is Planck's constant and is frequency.
Key Equation:
Planck's Law accurately describes the observed spectrum of blackbody radiation by assuming quantized energy levels.
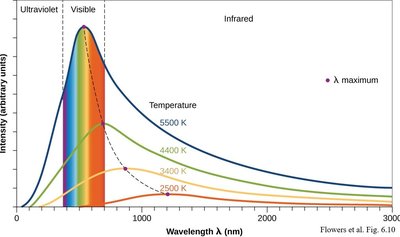
Example: The color of heated objects (e.g., red-hot iron) changes with temperature due to the shift in peak wavelength, as described by Wien's displacement law.
Photoelectric Effect
Experimental Observations and Quantum Explanation
The photoelectric effect is the emission of electrons from a metal surface when exposed to light of sufficient frequency.
Classical wave theory could not explain why light below a certain frequency, regardless of intensity, failed to eject electrons.
Albert Einstein explained the effect by proposing that light consists of photons, each with energy . An electron is ejected only if the photon energy exceeds the metal's work function ().
Key Equation:
Where is the maximum kinetic energy of ejected electrons, is the frequency of incident light, and is the work function.
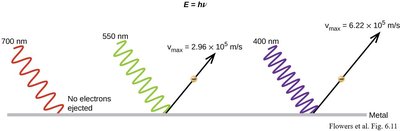
Example: For a Cs-In alloy with a work function of 1.72 eV (166 kJ/mol), only photons with energy greater than 1.72 eV (wavelength shorter than a threshold value) can eject electrons. The threshold wavelength can be calculated using .
Atomic Spectra
Line Spectra and Energy Levels
When atoms absorb energy, they emit light at specific wavelengths, producing a line spectrum rather than a continuous spectrum.
Each element has a unique emission spectrum, which can be used for identification (e.g., flame tests).
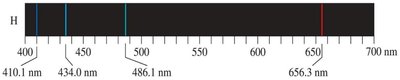
The hydrogen atom's visible emission lines are known as the Balmer series.
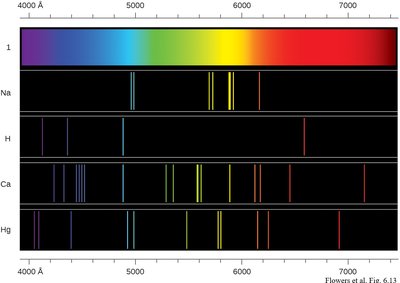
Example: The hydrogen emission spectrum in the visible region consists of lines at 410.1 nm, 434.0 nm, 486.1 nm, and 656.3 nm.

Bohr Model of the Hydrogen Atom
Niels Bohr proposed that electrons in a hydrogen atom occupy only certain allowed stationary states (energy levels) with quantized energies.
Electrons do not radiate energy while in a stationary state, but emit or absorb photons when transitioning between states.
The energy of the th level in a hydrogen-like atom is given by:
Where J (Rydberg constant), is the nuclear charge, and
The ground state is (lowest energy), and excited states are . corresponds to the ionization limit.
Electron Transitions: When an electron moves from a higher to a lower energy level, a photon is emitted with energy equal to the difference between the two levels.
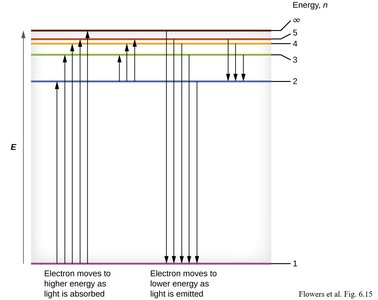
Hydrogen Emission Series
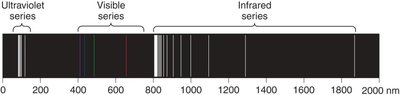
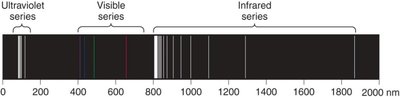
The Bohr model predicts several series of spectral lines, each corresponding to transitions ending at a specific final energy level ():
Series Name | Final Level () | Region |
|---|---|---|
Lyman | 1 | Ultraviolet |
Balmer | 2 | Visible |
Paschen | 3 | Infrared |
Brackett | 4 | Infrared |
Pfund | 5 | Infrared |
Humphrey | 6 | Infrared |
Example Calculation: Wavelength of Emitted Light
To calculate the wavelength of light emitted during a transition from to in hydrogen:
For a transition from to , substitute values to find .
This transition corresponds to one of the Balmer series lines in the visible spectrum.
Summary Table: Hydrogen Emission Series
Series | Final Level () | Region |
|---|---|---|
Lyman | 1 | Ultraviolet |
Balmer | 2 | Visible |
Paschen | 3 | Infrared |
Brackett | 4 | Infrared |
Pfund | 5 | Infrared |
Humphrey | 6 | Infrared |
Additional info: These quantum phenomena are foundational for understanding quantum mechanics, atomic structure, and the development of modern chemistry and physics.
