 뒤로
General Chemistry: Solutions, Solubility, and Kinetics Study Guide
스터디 가이드 - 스마트 노트
 자료에 맞춘 맞춤형 노트, 핵심 정의, 예시, 맥락을 확장해 제공합니다.
Q32. Identify the compound whose solubility is least affected by temperature.
Background
Topic: Solubility and Temperature Dependence
This question tests your understanding of how the solubility of different ionic compounds in water changes with temperature. Some salts show a strong dependence on temperature, while others do not.
Key Terms and Concepts:
Solubility: The amount of solute that can dissolve in a given amount of solvent at a specific temperature.
Temperature Dependence: For many solids, solubility increases with temperature, but for some, it remains nearly constant.
Step-by-Step Guidance
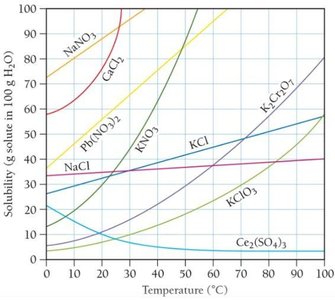
Examine the solubility curves for each compound on the provided graph. Look for the compound whose solubility line is the flattest (shows the least change) as temperature increases from 0°C to 100°C.
Compare the slopes of the lines for each compound. A steeper slope means greater temperature dependence, while a nearly horizontal line means little to no dependence.
Focus on the compounds listed in the answer choices: CaCl2, K2Cr2O7, KClO3, Pb(NO3)2, and NaCl. Find each on the graph and observe how much their solubility changes with temperature.
Identify which compound's solubility curve is closest to being horizontal across the temperature range.
Try solving on your own before revealing the answer!
Final Answer: NaCl
NaCl's solubility curve is nearly flat, indicating that its solubility is least affected by temperature compared to the other compounds listed. This means that increasing or decreasing the temperature has minimal effect on how much NaCl dissolves in water.
Q61. Using the tabulated data of the concentration of AB versus time and the plot of 1/[AB] with respect to time (s) for this reaction: AB (g) → A (g) + B (g). Predict the concentration of AB at 210 seconds.
Background
Topic: Reaction Order and Integrated Rate Laws
This question tests your ability to use integrated rate laws and graphical data to predict concentrations at a given time for a second-order reaction.
Key Terms and Formulas:
Second-Order Reaction: A reaction where the rate depends on the square of the concentration of one reactant, or the product of two reactant concentrations.
Integrated Rate Law for Second-Order (single reactant):
Slope of the Line: In a plot of vs. time, the slope equals the rate constant .
Step-by-Step Guidance
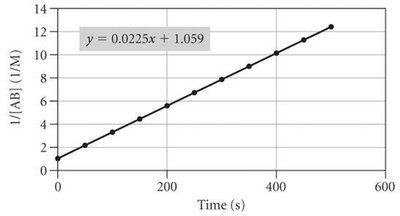
From the graph, note the equation of the line: , where and (time in seconds).
To find at s, substitute into the equation to solve for .
Once you have the value for , recall that .
Try solving on your own before revealing the answer!
Final Answer: 0.173 M
Substituting s into the equation: . Therefore, M.
This matches the expected value for a second-order reaction using the integrated rate law and the provided graph.
