 뒤로
Matter, Measurement, and Problem Solving: Dimensional Analysis and Data Interpretation
스터디 가이드 - 스마트 노트
 자료에 맞춘 맞춤형 노트, 핵심 정의, 예시, 맥락을 확장해 제공합니다.
Solving Chemical Problems
Dimensional Analysis
Dimensional analysis is a systematic approach to problem-solving in chemistry that involves using units as a guide throughout calculations. This method ensures accuracy and consistency, especially when converting between different units of measurement.
Definition: Dimensional analysis is the process of converting one set of units to another using conversion factors, treating units as algebraic quantities that can be multiplied, divided, and canceled.
Importance: Always include units in calculations to avoid errors and to ensure that the final answer is in the correct units.
Steps:
Identify the given quantity and its units.
Determine the required units for the answer.
Set up conversion factors so that units cancel appropriately.
Perform the calculation, canceling units as needed.
Check that the final answer has the correct units and significant figures.
Example 1: Convert 5 square inches to square centimeters.
1 inch = 2.54 cm, so 1 in2 = (2.54 cm)2 = 6.4516 cm2
Calculation:
Example 2: A rectangular piece of paper measures 3 inches by 4 inches. Calculate the area in square centimeters.
Area = 3 in × 4 in = 12 in2
Convert:
General Problem-Solving Strategy
Effective problem-solving in chemistry requires a clear understanding of the problem, careful attention to units, and verification of results.
Understand the Problem: Identify what is given and what needs to be found.
Consistent Units: Ensure all quantities are in compatible units before performing calculations.
Check Your Work: Review calculations and units to catch errors and confirm the answer makes sense.
Practice Problems
Practice Problem 1: A chemist produces 1.7 kilograms and 552.5 grams of sodium stearate in two rounds. What is the total mass in kilograms, with correct significant figures?
Convert 552.5 g to kg:
Total mass: (rounded to two significant figures)
Practice Problem 2: A sample of aluminum has a mass of 27.891 grams and a volume of 10.5 milliliters. What is the density?
Density formula:
Calculation: (rounded to three significant figures)
Interpreting Data and Graphs
Interpreting Data
Analyzing and interpreting data is a fundamental scientific skill that allows chemists to identify patterns, draw conclusions, and make predictions based on experimental results.
Application: Used in various fields such as health science, biomedical science, engineering, forensic science, and the arts.
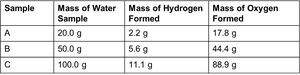
Example: Determining the composition of water by analyzing the masses of hydrogen and oxygen formed from different samples.
Sample | Mass of Water Sample | Mass of Hydrogen Formed | Mass of Oxygen Formed |
|---|---|---|---|
A | 20.0 g | 2.2 g | 17.8 g |
B | 50.0 g | 5.6 g | 44.4 g |
C | 100.0 g | 11.1 g | 88.9 g |
Patterns Observed:
The sum of the masses of hydrogen and oxygen equals the mass of the water sample.
The ratio of the mass of oxygen to hydrogen is approximately 8:1 for each sample, demonstrating the law of definite proportions.
Conclusion: Consistent ratios and mass relationships can help identify unknown substances.
Interpreting Graphs
Graphs are essential tools for visualizing data trends and relationships in chemistry. Understanding how to read and interpret graphs is crucial for analyzing scientific data.
Key Steps:
Examine the x-axis and y-axis to understand what variables are being plotted.
Note the numerical range and units of each axis.
Identify trends, such as increases, decreases, or constant values.
Analyze the slope to determine the rate of change.
Example: The graph below shows the atmospheric concentration of carbon dioxide over time. The data reveal that CO2 levels have increased, with the rate of increase accelerating since about 1960.
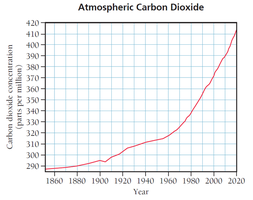
Scientific Insight: Such graphs help scientists understand environmental changes and the impact of human activities on atmospheric composition.
