 뒤로
뒤로Phase Diagrams and Properties of Liquids and Solids – Guided Study
스터디 가이드 - 스마트 노트
 자료에 맞춘 맞춤형 노트, 핵심 정의, 예시, 맥락을 확장해 제공합니다.
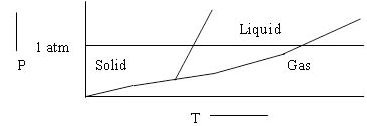
Q11. Choose the correct statement about the diagram below.
Background
Topic: Phase Diagrams
This question tests your understanding of how to interpret a phase diagram, which shows the states of matter (solid, liquid, gas) as a function of temperature and pressure. You need to identify which statement about the diagram is correct, considering features like the melting point, triple point, and how pressure affects phase changes.
Key Terms and Concepts:
Phase diagram: A graph showing the state of a substance at various temperatures and pressures.
Triple point: The unique set of conditions where all three phases coexist.
Melting point: The temperature at which a solid turns into a liquid at a given pressure.
Critical point: The end point of the liquid-gas boundary.
Step-by-Step Guidance
Examine the diagram and identify the regions labeled as solid, liquid, and gas. Notice how the boundaries between these regions are drawn.
Observe the slope of the solid-liquid boundary. For water, this line slopes to the left, indicating that increasing pressure lowers the melting point. For most substances, it slopes to the right.
Check the location of the triple point relative to 1 atm pressure. Is it above, below, or at 1 atm?
Consider which substance the diagram could represent based on these features (e.g., water vs. CO2).
Review each answer choice and eliminate those that do not match the features you observe in the diagram.
Try solving on your own before revealing the answer!
Final Answer: b) The diagram shows that the melting point of the solid increases with increasing pressure.
The solid-liquid boundary in this diagram slopes to the right, which means that as pressure increases, the melting point also increases. This is typical for most substances (but not for water, where the line slopes left). The triple point is below 1 atm, and the diagram does not match water or CO2 exactly, but statement b is correct for this diagram.
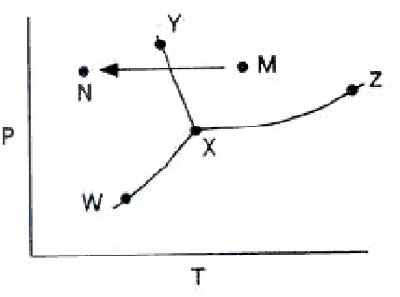
Q12. From a consideration of the phase diagram below, a change from point M to point N corresponds to:
Background
Topic: Phase Changes on a Phase Diagram
This question asks you to interpret a phase diagram and determine what phase change occurs when moving from one point (M) to another (N). You need to understand the regions and boundaries on the diagram and what a horizontal or vertical movement means.
Key Terms and Concepts:
Phase boundaries: Lines separating solid, liquid, and gas regions.
Sublimation: Solid to gas transition.
Condensation: Gas to liquid transition.
Evaporation: Liquid to gas transition.
Freezing: Liquid to solid transition.
Liquefaction: Gas to liquid transition (same as condensation).
Step-by-Step Guidance
Locate points M and N on the diagram. Note their positions relative to the phase boundaries.
Determine which phases are present at M and N (e.g., is M in the liquid region and N in the solid region?).
Observe the direction of the change (is it a decrease in temperature, pressure, or both?).
Identify the phase change that occurs when moving from M to N based on the regions crossed.
Try solving on your own before revealing the answer!
Final Answer: d) Freezing
Moving from M to N crosses the liquid-solid boundary, indicating a transition from liquid to solid, which is freezing.
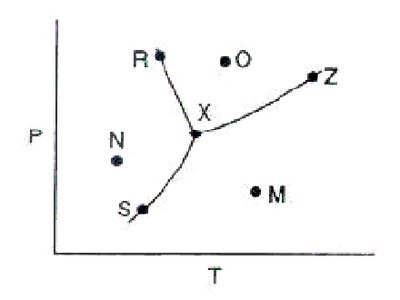
Q13. Below is a phase diagram for a substance. What is the name for point Z on the diagram?
Background
Topic: Critical Point and Triple Point on Phase Diagrams
This question tests your ability to identify special points on a phase diagram, such as the triple point (where all three phases coexist) and the critical point (the end of the liquid-gas boundary).
Key Terms and Concepts:
Critical point: The temperature and pressure above which a substance cannot exist as a liquid, regardless of pressure.
Triple point: The unique set of conditions where solid, liquid, and gas phases coexist in equilibrium.
Normal boiling point: The temperature at which the vapor pressure of the liquid equals 1 atm.
Step-by-Step Guidance
Locate point Z on the diagram. Is it at the end of the liquid-gas boundary or at the intersection of all three phase boundaries?
Recall the definitions of the critical point and triple point.
Compare the location of Z to the typical positions of these points on a phase diagram.
Eliminate answer choices that do not match the location of Z.
Try solving on your own before revealing the answer!
Final Answer: d) Critical point
Point Z is at the end of the liquid-gas boundary, which is the critical point. Beyond this point, the liquid and gas phases are indistinguishable.
