Ch.17 - Additional Aspects of Aqueous Equilibria
Brown - Chemistry: The Central Science 15th Edition
Brown15th EditionChemistry: The Central ScienceISBN: 9780137542970당신이 사용하는 게 아니라요?교과서 변경
17장, 문제 6a

Match the following descriptions of titration curves with the diagrams: (a) strong acid added to strong base. [Section 17.3]

검증된 단계별 안내
1
Identify the characteristics of a titration curve for a strong acid added to a strong base.
Recall that the equivalence point for a strong acid-strong base titration occurs at a pH of 7.
Understand that the initial pH of the solution will be high because it starts with a strong base.
As the strong acid is added, the pH will decrease gradually until it reaches the equivalence point.
After the equivalence point, the pH will decrease more rapidly as excess strong acid is added.

비슷한 문제에 대한 검증된 영상 답변:

이 영상 해법은 위 문제에 도움이 된다고 튜터들이 추천한 것입니다.
영상 길이:
1m

주요 개념

질문에 올바르게 답하기 위해 반드시 이해해야 하는 핵심 개념들은 다음과 같습니다.

Titration Curves

Titration curves graphically represent the pH changes that occur during the titration process. They plot the volume of titrant added against the pH of the solution, illustrating how the acidity or basicity of the solution changes as the titrant is added. Understanding these curves is essential for interpreting the neutralization point and the strength of the acids and bases involved.
추천 영상:
가이드 코스
02:16
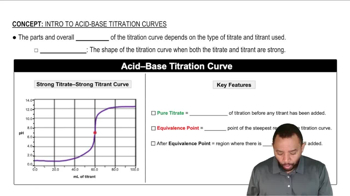
Acid-Base Titration Curves

Strong Acid and Strong Base

A strong acid completely dissociates in solution, releasing all of its hydrogen ions (H+), while a strong base completely dissociates to release hydroxide ions (OH-). When titrating a strong acid with a strong base, the resulting titration curve typically shows a sharp increase in pH at the equivalence point, where the amount of acid equals the amount of base, leading to a neutral solution.
추천 영상:
가이드 코스
01:09
Strong Acid-Strong Base Titration

Equivalence Point

The equivalence point in a titration is the stage at which the amount of titrant added is stoichiometrically equivalent to the amount of substance being titrated. For a strong acid-strong base titration, this point is characterized by a rapid change in pH, typically occurring around pH 7. Understanding the equivalence point is crucial for determining the concentration of the unknown solution.
추천 영상:
가이드 코스
01:07
At the Equivalence Point
관련 실천
교과서 질문

The following diagram represents a buffer composed of equal concentrations of a weak acid, HA, and its conjugate base, A-. The heights of the columns are proportional to the concentrations of the components of the buffer. (c) Which of the three represents a situation that cannot arise from the addition of either an acid or a base? [Section 17.2]

694
views
교과서 질문

Match the following descriptions of titration curves with the diagrams: (d) strong base added to polyprotic acid. [Section 17.3]

426
views
교과서 질문

The following figure represents solutions at various stages of the titration of a weak acid, HA, with NaOH. (The Na+ ions and water molecules have been omitted for clarity.) To which of the following regions of the titration curve does each drawing correspond: (b) after addition of NaOH but before the equivalence point? [Section 17.3]

1274
views
교과서 질문

The following diagram represents a buffer composed of equal concentrations of a weak acid, HA, and its conjugate base, A-. The heights of the columns are proportional to the concentrations of the components of the buffer. (a) Which of the three drawings, (1), (2), or (3), represents the buffer after the addition of a strong acid? [Section 17.2]

377
views
교과서 질문

The following graphs represent the behavior of BaCO3 under different circumstances. In each case, the vertical axis indicates the solubility of the BaCO3 and the horizontal axis represents the concentration of some other reagent. (a) Which graph represents what happens to the solubility of BaCO3 as HNO3 is added? [Section 17.5]

700
views