Ch.14 - Chemical Kinetics
Tro - Chemistry: A Molecular Approach 4th Edition
Tro4th EditionChemistry: A Molecular ApproachISBN: 9780134112831당신이 사용하는 게 아니라요?교과서 변경
14장, 문제 96a

Consider the reaction in which HCl adds across the double bond of ethene: HCl + H2C=CH2 → H3C-CH2Cl The following mechanism, with the accompanying energy diagram, has been suggested for this reaction:
Step 1 HCl + H2C=CH2 → H3C=CH2+ + Cl-
Step 2 H3C=CH2+ + Cl- → H3C-CH2Cl
a. Based on the energy diagram, determine which step is rate limiting.

검증된 단계별 안내
1
Identify the rate-limiting step as the one with the highest energy barrier in the energy diagram.
Examine the energy diagram to find the step with the largest activation energy, which is the energy difference between the reactants and the transition state.
In the given mechanism, compare the energy levels of the transition states for Step 1 and Step 2.
The step with the higher transition state energy compared to its starting materials is the rate-limiting step.
Conclude that the step with the highest energy barrier is the rate-limiting step, as it determines the overall reaction rate.

비슷한 문제에 대한 검증된 영상 답변:

이 영상 해법은 위 문제에 도움이 된다고 튜터들이 추천한 것입니다.
영상 길이:
1m

주요 개념

질문에 올바르게 답하기 위해 반드시 이해해야 하는 핵심 개념들은 다음과 같습니다.

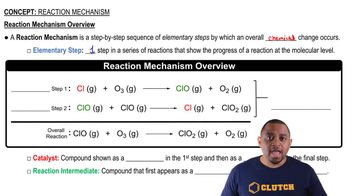
Reaction Mechanism

A reaction mechanism describes the step-by-step sequence of elementary reactions by which overall chemical change occurs. In this case, the mechanism involves two steps: the formation of a carbocation intermediate and its subsequent reaction with a chloride ion. Understanding the mechanism is crucial for analyzing how reactants transform into products and identifying the rate-limiting step.
추천 영상:
가이드 코스
03:06
Reaction Mechanism Overview

Rate Limiting Step

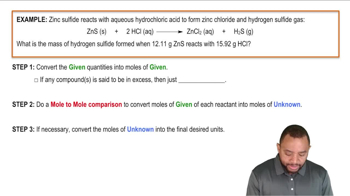
The rate limiting step in a reaction mechanism is the slowest step that determines the overall rate of the reaction. It is often characterized by a higher activation energy compared to other steps. In the provided mechanism, identifying which step is rate limiting involves examining the energy diagram to see where the largest energy barrier occurs, indicating the step that will take the longest to proceed.
추천 영상:
가이드 코스
4:53
Limiting Reagent Example

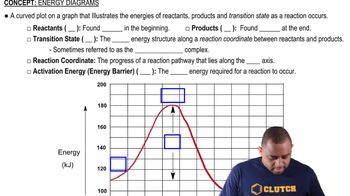
Energy Diagram

An energy diagram visually represents the energy changes during a chemical reaction, showing the energy of reactants, products, and intermediates. It typically includes activation energies for each step and the overall energy change. By analyzing the energy diagram associated with the reaction, one can determine the relative energies of the transition states and identify the rate limiting step based on the highest peak in the diagram.
추천 영상:
가이드 코스
01:57
Energy Diagrams