 뒤로
뒤로Polygenic (Quantitative) Inheritance and Heritability
스터디 가이드 - 스마트 노트
 자료에 맞춘 맞춤형 노트, 핵심 정의, 예시, 맥락을 확장해 제공합니다.
Polygenic (Quantitative) Inheritance
Introduction to Polygenic Inheritance
Polygenic inheritance, also known as quantitative inheritance, refers to the genetic determination of traits that are controlled by multiple genes, each contributing a small additive effect to the phenotype. Unlike Mendelian traits, which show discrete categories, polygenic traits exhibit continuous variation within a population.
Polygenic Traits: Traits influenced by two or more genes (polygenes).
Continuous Variation: Phenotypes show a range of values (e.g., height, skin color).
Discontinuous Variation: Phenotypes fall into distinct categories (e.g., Mendel’s pea traits).
Multifactorial Traits: Traits influenced by both genetic and environmental factors.
Key Terms in Quantitative Genetics
Multiple Gene Hypothesis: Proposes that quantitative traits are governed by multiple genes, each behaving in a Mendelian fashion but contributing additively to the phenotype.
Additive Alleles: Alleles that contribute equally and cumulatively to the phenotype.
Nonadditive Alleles: Alleles that do not contribute to the quantitative trait.
Meristic Traits: Quantitative traits measured in whole numbers (e.g., number of bristles in Drosophila).
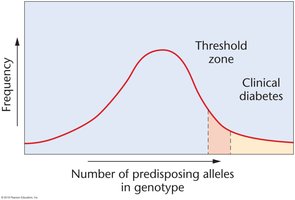
Threshold Traits: Polygenic traits that are expressed in a limited number of discrete phenotypic classes, often related to disease susceptibility.
Examples of Quantitative Traits
Anatomical: Height, weight, ear length in corn, degree of pigmentation.
Physiological: Metabolic rate, milk production, temperature tolerance.
Pathological (Threshold Traits): Atherosclerosis, hypertension, cancer, diabetes, arthritis, obesity.
Threshold Traits
Threshold traits are polygenic and often multifactorial, with only a small number of discrete phenotypic classes. An individual develops the trait (e.g., clinical diabetes) only if their genetic liability (number of predisposing alleles) exceeds a certain threshold, often influenced by environmental factors.
Genetic Basis of Polygenic Inheritance
Continuous vs. Discontinuous Variation
Continuous variation results from the additive effects of multiple genes, producing a spectrum of phenotypes. Discontinuous variation, typical of Mendelian traits, results in distinct categories.
Continuous: Infinite gradations (e.g., height).
Discontinuous: Distinct categories (e.g., round vs. wrinkled peas).
Grain Color in Wheat: A Classic Example
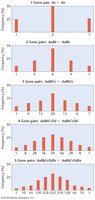
Nilsson-Ehle’s experiments with wheat grain color demonstrated polygenic inheritance. Crossing red and white wheat produced F1 pink grains, and F2 showed five phenotypic classes in a 1:4:6:4:1 ratio, explained by two additive gene pairs.
Multiple Gene Hypothesis
Bateson and Yule proposed that multiple genes, each inherited in a Mendelian fashion, contribute additively to quantitative traits. The cumulative effect of additive alleles determines the phenotype.
Additive Alleles: Each allele contributes equally to the phenotype.
Dosage Dependence: The number of additive alleles determines the degree of trait expression.
Determining the Number of Polygenes
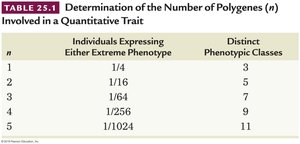
The number of genes involved in a quantitative trait can be estimated using the ratio of extreme phenotypes in the F2 generation or by counting the number of distinct phenotypic classes.
Extreme F2 Ratio Method:
Phenotypic Class Method:
n | Individuals Expressing Either Extreme Phenotype | Distinct Phenotypic Classes |
|---|---|---|
1 | 1/4 | 3 |
2 | 1/16 | 5 |
3 | 1/64 | 7 |
4 | 1/256 | 9 |
5 | 1/1024 | 11 |
Distribution of F2 Phenotypes and Binomial Expansion
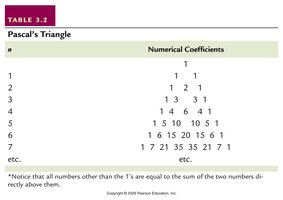
The distribution of phenotypes in the F2 generation follows binomial expansion, with the number of phenotypic classes and their frequencies determined by the number of gene pairs involved. The coefficients can be found using Pascal’s Triangle.
Sample Problems in Polygenic Inheritance
Sample Calculation: Number of Polygenes
Given a cross where 1/64 of F2 individuals resemble each parental extreme and there are 7 phenotypic classes, the number of polygenes (n) can be calculated as follows:
Extreme ratio method:
Phenotypic class method:
Skunk Stripe Length Problem
In a cross between two inbred skunk strains with stripe lengths of 20 cm and 24 cm, F1 hybrids have 22 cm stripes. F2 offspring show a range from 16 cm to 28 cm in 2 cm increments, with the most frequent being 22 cm. The mode of inheritance is polygenic, and the number of gene pairs can be deduced from the number of phenotypic classes (7 classes: n = 3 gene pairs).
Genotypes of Parents: One parent is homozygous for all additive alleles, the other for all nonadditive alleles.
F1 Genotype: Heterozygous at all loci.
Each additive allele contributes: 2 cm to stripe length.
Heritability
Definition and Importance
Heritability measures the proportion of total phenotypic variation in a population that is attributable to genetic differences among individuals. It is context-specific and can change with environmental conditions.
High Heritability: Most variation is due to genetic factors.
Low Heritability: Most variation is due to environmental factors.
Heritability does not: Indicate how much of a trait is genetically determined in an individual or the extent of genetic control over the trait’s expression.
Partitioning Phenotypic Variance
Total phenotypic variance () can be partitioned into genetic variance (), environmental variance (), and genotype-by-environment interaction variance ():
In practice, is often assumed to be negligible.
Broad-Sense Heritability ()
Broad-sense heritability is the proportion of total phenotypic variance due to all genetic variance:
Ranges from 0 (all environmental) to 1 (all genetic).
Example: for human height means 65% of the variation in height is due to genetic differences in that population and environment.
Narrow-Sense Heritability ()
Narrow-sense heritability considers only additive genetic variance ():
Additive Variance (): Effects of individual alleles summed across loci.
Dominance Variance (): Effects due to interactions between alleles at the same locus.
Interactive Variance (): Effects due to interactions between alleles at different loci (epistasis).
Experimental Approaches
Inbred Strains: Used to separate genetic and environmental variance by comparing variance within and between genetically uniform lines.
Summary Table: Determination of Polygenes
n | Individuals Expressing Either Extreme Phenotype | Distinct Phenotypic Classes |
|---|---|---|
1 | 1/4 | 3 |
2 | 1/16 | 5 |
3 | 1/64 | 7 |
4 | 1/256 | 9 |
5 | 1/1024 | 11 |
Summary Table: Pascal's Triangle for Binomial Coefficients
n | Numerical Coefficients |
|---|---|
1 | 1 1 |
2 | 1 2 1 |
3 | 1 3 3 1 |
4 | 1 4 6 4 1 |
5 | 1 5 10 10 5 1 |
6 | 1 6 15 20 15 6 1 |
7 | 1 7 21 35 35 21 7 1 |
Additional info: The above notes integrate foundational concepts from quantitative genetics, including the calculation of polygenes, the role of additive alleles, and the partitioning of phenotypic variance, as well as the application of binomial expansion and heritability in population studies.
