 뒤로
뒤로Cellular Respiration: Citric Acid Cycle & Electron Transport System
스터디 가이드 - 스마트 노트
 자료에 맞춘 맞춤형 노트, 핵심 정의, 예시, 맥락을 확장해 제공합니다.
Cellular Respiration: Citric Acid Cycle & Electron Transport System
Overview of Cellular Respiration
Cellular respiration is the process by which cells extract energy from nutrients, primarily glucose, to produce adenosine triphosphate (ATP), the main energy currency of the cell. This process involves a series of metabolic pathways, including glycolysis, the citric acid cycle (Krebs cycle), and the electron transport system.

The Citric Acid Cycle (Krebs Cycle)
Location and General Function
The citric acid cycle, also known as the Krebs cycle, occurs in the inner membrane region of the mitochondria. It is the central metabolic pathway that completes the oxidation of organic molecules, generating electron carriers for the electron transport system.
Occurs in the mitochondrial matrix.
Each glucose molecule produces two acetyl groups, so the cycle turns twice per glucose.
Main function: Harvest high-energy electrons from carbon fuels.
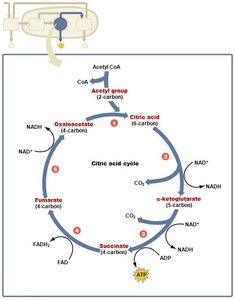
Steps of the Citric Acid Cycle
Acetyl CoA delivers acetyl group (2 carbons) to oxaloacetate (4 carbons), forming citric acid (6 carbons).
Citric acid is metabolized: One carbon is removed as CO2; NAD+ is reduced to NADH; forms α-ketoglutarate (5 carbons).
α-Ketoglutarate is metabolized: Another carbon is removed as CO2; NAD+ is reduced to NADH; ADP is phosphorylated to ATP; forms succinate (4 carbons).
Succinate is metabolized: FAD is reduced to FADH2; forms fumarate (4 carbons).
Fumarate is metabolized: NAD+ is reduced to NADH; regenerates oxaloacetate (4 carbons).
Note: These steps are for one acetyl group; double the totals for one glucose molecule.
Coenzymes in the Citric Acid Cycle
NAD+ (Nicotinamide adenine dinucleotide): Accepts electrons and hydrogen ions to become NADH.
FAD (Flavin adenine dinucleotide): Accepts electrons and hydrogen ions to become FADH2.
Both coenzymes transport high-energy electrons to the electron transport system.
Summary of the Citric Acid Cycle (per glucose molecule)
ATP produced: 2 (by substrate-level phosphorylation)
NADH produced: 6
FADH2 produced: 2
CO2 produced: 4 (waste)
Oxaloacetate: Regenerated to continue the cycle
Electron Transport System (ETS)
Location and Function
The electron transport system is located in the inner mitochondrial membrane (cristae). It uses electrons from NADH and FADH2 to generate a proton gradient, which drives ATP synthesis.
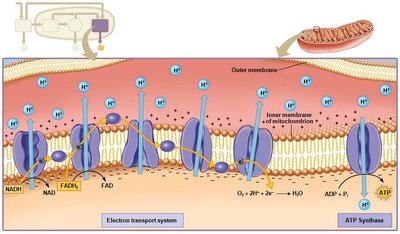
Steps of the Electron Transport System
NADH and FADH2 donate electrons to carrier proteins in the inner mitochondrial membrane.
Electrons are passed along the chain, releasing energy used to pump H+ ions into the intermembrane space.
This creates a high concentration of H+ ions outside the inner membrane.
H+ ions flow back into the matrix through ATP synthase channels, catalyzing the formation of ATP from ADP and inorganic phosphate (Pi).
Oxygen acts as the final electron acceptor, combining with H+ and electrons to form water.
Equation for water formation:
ATP Yield from Electron Transport System
Approximately 34 ATP molecules are produced by oxidative phosphorylation.
NADH and FADH2 are recycled for further use.
Water: 6 molecules produced as waste.
Overall Summary of Cellular Respiration
Cellular respiration involves over 20 chemical reactions to completely catabolize glucose. The process is highly efficient, producing energy slowly and in a controlled manner.
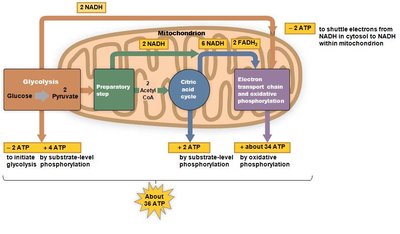
Stage | ATP Produced | Electron Carriers Produced |
|---|---|---|
Glycolysis | 2 | 2 NADH |
Preparatory Step | 0 | 2 NADH |
Citric Acid Cycle | 2 | 6 NADH, 2 FADH2 |
Electron Transport System | ~34 | - |
Total | ~38 (gross), 36 (net) | - |
Net ATP gain: 36 (2 ATP used to shuttle NADH into mitochondria)
Waste products: 6 CO2, 6 H2O
Alternative Energy Sources: Fats and Proteins
Catabolism of Fats
Fats are the largest energy reserve in the body (about 78%).
Triglycerides are broken down into glycerol and fatty acids.
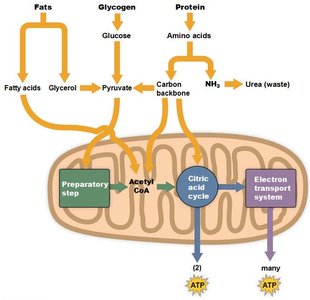
Glycerol can be converted to glucose (glycolysis) or pyruvate (preparatory step).
Fatty acids are converted into acetyl groups, which enter the citric acid cycle.
Fat catabolism produces about twice as much ATP as glycogen.
Catabolism of Proteins
Proteins are broken down into amino acids.
The amine group (NH2) is removed and excreted as urea.
The remaining carbon backbone enters the citric acid cycle at various points.
Protein catabolism increases during starvation, leading to muscle wasting.
Anaerobic Respiration
ATP Production Without Oxygen
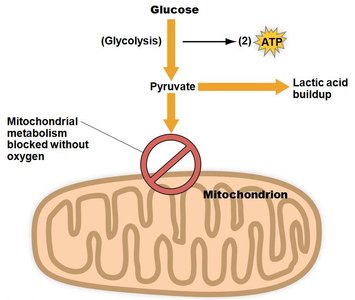
Anaerobic respiration allows cells to produce ATP in the absence of oxygen, but only for short periods. Glycolysis is the main anaerobic pathway in humans.
During anaerobic respiration, pyruvate does not enter the mitochondria.
Pyruvate is converted into lactic acid, which causes muscle burning and cramping.
Only 2 ATP are produced per glucose molecule in anaerobic conditions.
References
Johnson, M.D. (2017). Human Biology: Concepts and Current Issues (8th ed). Pearson Education Inc.
