 뒤로
Electrons and the Periodic Table: Foundations of Atomic Structure and Periodicity
스터디 가이드 - 스마트 노트
 자료에 맞춘 맞춤형 노트, 핵심 정의, 예시, 맥락을 확장해 제공합니다.
Chapter 2: Electrons and the Periodic Table
2.1 The Nature of Light
Understanding the nature of light is essential for explaining atomic structure and the behavior of electrons. Light exhibits both wave-like and particle-like properties, which are fundamental to the development of atomic models.
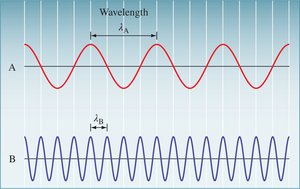
Wavelength (\(\lambda\)): The distance between identical points on successive waves.
Frequency (\(\nu\)): The number of waves that pass a given point in space in one second.
As wavelength increases, frequency decreases, and vice versa.
The energy of light is directly proportional to its frequency and inversely proportional to its wavelength.
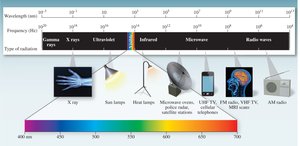
The electromagnetic spectrum arranges all types of electromagnetic radiation, including visible light, gamma rays, X-rays, ultraviolet, infrared, microwaves, and radio waves.
Shorter wavelengths (e.g., gamma rays) have higher frequencies and greater energy; longer wavelengths (e.g., radio waves) have lower frequencies and less energy.
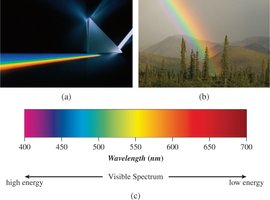
The visible spectrum is a small portion of the electromagnetic spectrum, ranging from approximately 400 nm (violet) to 700 nm (red).
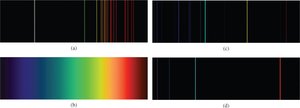
Emission spectra from atoms are not continuous but contain discrete lines, known as line spectra. These were critical in developing atomic models.
2.2 The Bohr Atom
The Bohr model of the atom was developed to explain the discrete line spectra observed for hydrogen. It introduced the concept of quantized energy levels for electrons.
Photons: Tiny, discrete packets of light energy.
Niels Bohr proposed that electrons move in specific circular orbits around the nucleus, each with a fixed energy level designated by the quantum number \(n\).
The lowest energy level (\(n = 1\)) is called the ground state. Higher energy levels (\(n > 1\)) are excited states.
When an electron absorbs energy, it is promoted to a higher energy level. When it returns to a lower energy level, it emits energy as electromagnetic radiation.
For hydrogen, transitions from higher levels (\(n = 3, 4, 5, 6\)) to \(n = 2\) produce visible light emissions.
The Bohr model successfully explained the hydrogen spectrum but failed for atoms with more than one electron.
2.3 Atomic Orbitals
The quantum mechanical (QM) model replaced the Bohr model for multi-electron atoms. It describes electrons as existing in regions of space called orbitals, where the probability of finding an electron is highest.
Unlike Bohr's fixed orbits, QM orbitals vary in shape and are defined by probability distributions.
Principal energy levels (shells, \(n = 1, 2, 3, ...\)) contain one or more sublevels (subshells: s, p, d, f), each with a specific number of orbitals.
The number of sublevels in a principal energy level equals \(n\).
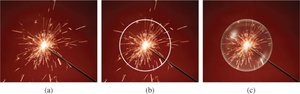
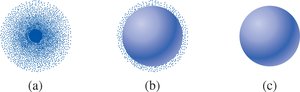
Electron density maps show the probability of finding an electron in a given region, called atomic orbitals.
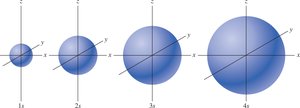
s orbitals are spherical; their size increases with increasing principal quantum number (1s, 2s, 3s, 4s).
Beginning with \(n = 2\), p sublevels (three p orbitals, dumbbell-shaped) are present, oriented along the x, y, and z axes.
For \(n = 3\), d sublevels (five d orbitals) are present; for \(n = 4\), f sublevels (seven f orbitals) are present.
Energy diagrams show the order and energy splitting of sublevels.
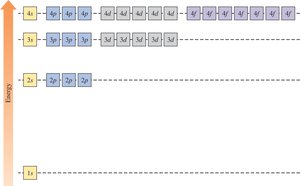
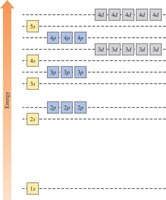
2.4 Electron Configuration
The electron configuration of an atom describes the arrangement of electrons in its orbitals. This configuration determines the chemical behavior of the atom.
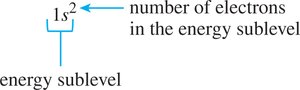
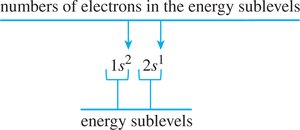
Electron configurations are written as a sequence of sublevel labels with superscripts indicating the number of electrons (e.g., 1s22s22p6).
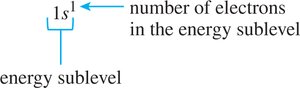
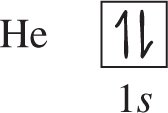
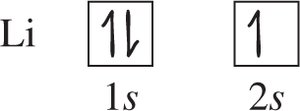
Orbital diagrams use boxes for orbitals and arrows for electrons, showing their spins.
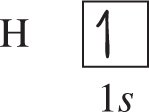
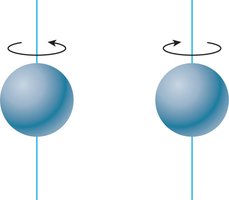
Pauli Exclusion Principle: Each orbital can hold a maximum of two electrons with opposite spins.
Hund's Rule: Electrons occupy orbitals of equal energy singly before pairing up.
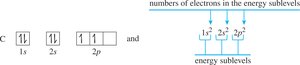
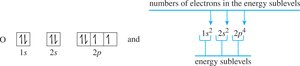
Noble gas core notation abbreviates electron configurations using the symbol of the previous noble gas in brackets (e.g., [Ne]3s1 for sodium).
2.5 Electron Configuration and the Periodic Table
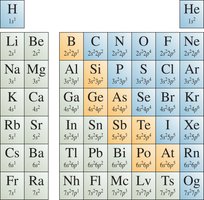
The periodic table is organized to reflect the electron configurations of the elements. The table can be divided into blocks (s, p, d, f) corresponding to the type of orbital being filled.
To determine an element's electron configuration, start with the nearest noble gas and fill orbitals according to the periodic table's structure.
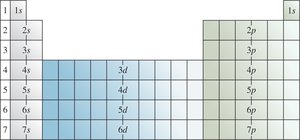
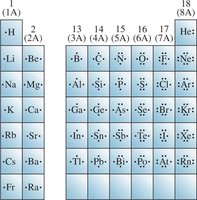
Valence electrons are those in the outermost shell (highest n value) and determine chemical reactivity.
Core electrons are those in inner shells.
Lewis dot symbols represent valence electrons as dots around the element symbol, with a maximum of eight dots.
2.6 Periodic Trends
Periodic trends describe how certain properties of elements change across periods and groups in the periodic table.
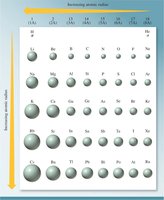
Atomic radius decreases from bottom left to top right across the main group elements.
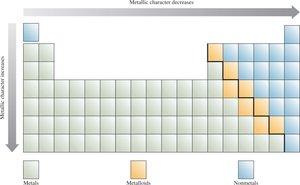
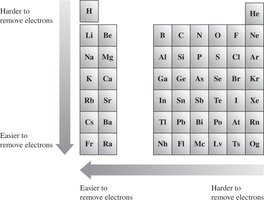
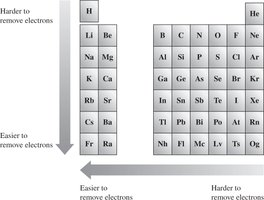
Metallic character (ease of losing electrons) decreases from bottom left to top right; nonmetallic character (tendency to gain electrons) increases in the same direction.
Ionization energy (energy required to remove an electron) increases from bottom left to top right.
Electron affinity (energy change when an atom gains an electron) increases from bottom left to top right.
2.7 Ions: The Loss and Gain of Electrons
Atoms form ions by losing or gaining electrons to achieve a stable, noble-gas electron configuration. This process is governed by periodic trends and the position of the element in the periodic table.
Cations are positively charged ions formed by the loss of electrons (typically metals).
Anions are negatively charged ions formed by the gain of electrons (typically nonmetals).
Main-group elements form ions with predictable charges based on their group number (e.g., Group 1: +1, Group 17: –1).
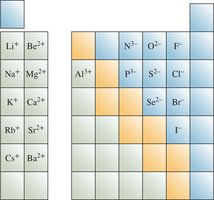
Isoelectronic species have the same number of electrons (e.g., Ca2+ and Ar).
Lewis dot symbols can also represent ions, showing the gain or loss of electrons.
