 뒤로
Graphs, Paths, and Circuits: Modeling Relationships in Liberal Arts Math
스터디 가이드 - 스마트 노트
 자료에 맞춘 맞춤형 노트, 핵심 정의, 예시, 맥락을 확장해 제공합니다.
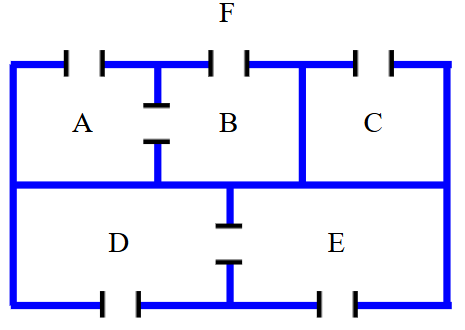
Q1. Draw a graph that models the connecting relationships in the floor plan. Use vertices to represent the rooms and the outside, and edges to represent the connecting doors.
Background
Topic: Graph Theory & Modeling
This question is testing your ability to use graphs to model real-world relationships, specifically how rooms and doors in a floor plan can be represented as vertices and edges. This is a foundational concept in graph theory, which is often covered in Liberal Arts Math to help students understand networks and connections.
Key Terms and Formulas
Vertex: A point representing a room or the outside area.
Edge: A line connecting two vertices, representing a door between rooms or between a room and the outside.
Graph: A collection of vertices and edges that model relationships.
Step-by-Step Guidance
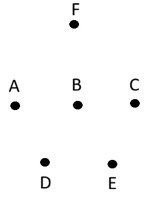
Identify each room and the outside as a vertex. In this floor plan, label the rooms as A, B, C, D, E, and the outside as F.
For each door in the floor plan, draw an edge connecting the two rooms (or room and outside) that the door links.
Check the diagram to see which rooms are directly connected by doors. For example, if there is a door between A and B, draw an edge between vertices A and B.
Continue this process for all doors, making sure every connection is represented in your graph.
Once all edges are drawn, review your graph to ensure it accurately models the floor plan's connectivity. The next step is to compare your graph to the provided example to see if all connections are included.
Try solving on your own before revealing the answer!
Final Answer:
The graph should have vertices labeled A, B, C, D, E, and F. Edges should connect vertices according to the doors in the floor plan:
A is connected to F and B
B is connected to F, A, C, D, and E
C is connected to F and B
D is connected to B and F
E is connected to B and F
F is connected to A, B, C, D, and E
This graph models the connecting relationships in the floor plan, with each edge representing a door between rooms or between a room and the outside.
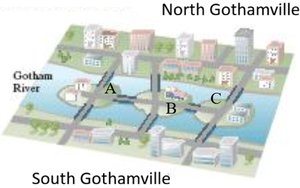
Q2. Using vertices to represent land masses and edges to represent bridges, graph the layout of the city shown in the map. Let A, B, C represent the islands as shown, and N, S represent the north and south sides of the river.
Background
Topic: Graph Theory & Urban Modeling
This question is testing your ability to use graphs to represent a city's layout, specifically how islands and riverbanks (land masses) can be modeled as vertices, and bridges as edges. This is a classic application of graph theory, often used to analyze connectivity and paths in urban planning.
Key Terms and Formulas
Vertex: Represents a land mass (island or riverbank).
Edge: Represents a bridge connecting two land masses.
Graph: A collection of vertices and edges modeling the city's layout.
Step-by-Step Guidance
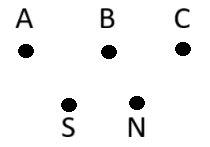
Identify each land mass as a vertex: A, B, C (islands), N (north side), S (south side).
For each bridge in the city map, draw an edge connecting the two land masses it links.
Examine the map to determine which land masses are connected by bridges. For example, if a bridge connects A and N, draw an edge between A and N.
Repeat this process for all bridges, ensuring every connection is represented in your graph.
After drawing all edges, review your graph to confirm it accurately models the city's bridge layout. The next step is to compare your graph to the provided example to check for completeness.
Try solving on your own before revealing the answer!
Final Answer:
The graph should have vertices labeled A, B, C, N, and S. Edges should connect vertices according to the bridges in the city map:
A is connected to N, S, and B
B is connected to A, C, N, and S
C is connected to N, S, and B
N is connected to A, B, and C
S is connected to A, B, and C
This graph models the layout of the city, with each edge representing a bridge between land masses.
