 뒤로
뒤로Chapter 1: Economics—Foundations and Models (with Graphs and Formulas Appendix)
스터디 가이드 - 스마트 노트
 자료에 맞춘 맞춤형 노트, 핵심 정의, 예시, 맥락을 확장해 제공합니다.
Economics: Foundations and Models
Introduction to Economics
Economics is the study of how people make choices to attain their goals, given their scarce resources. Because resources are limited but wants are unlimited, individuals, firms, and governments must make choices, leading to the study of economics. Economists use models—simplified versions of reality—to analyze real-world economic situations.
Scarcity and the Need for Choices
Scarcity: A situation in which unlimited wants exceed the limited resources available to fulfill those wants.
Trade-off: Choosing more of one good or service means producing less of another due to limited resources.
Opportunity Cost: The highest-valued alternative that must be given up to engage in an activity.
Example: Funding space exploration may mean less funding for cancer research.
1.1 Three Key Economic Ideas
People Are Rational
Individuals and firms use all available information to achieve their goals and weigh costs and benefits to make the best possible decisions.
Example: Apple sets iPhone prices to maximize profit, not randomly.
People Respond to Economic Incentives
As incentives change, so do the actions of individuals and firms.
Example: DNA databases for felons reduce repeat offenses, showing even criminals respond to incentives.
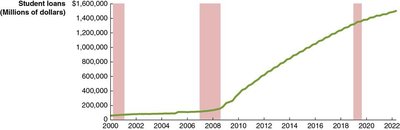
Application: Changes in student loan repayment rules may incentivize colleges to increase tuition and students to borrow more.
Optimal Decisions Are Made at the Margin
Most decisions involve doing a little more or less of something, not all-or-nothing choices.
Marginal Analysis: Comparing the additional benefit (marginal benefit) and additional cost (marginal cost) of an activity.
Example: Deciding whether to study an extra hour or watch TV.
1.2 The Economic Problem That Every Society Must Solve
Three Fundamental Economic Questions
What goods and services will be produced? Determined by choices of individuals, firms, and governments.
How will the goods and services be produced? Firms choose production methods based on costs and available technology.
Who will receive the goods and services produced? Distribution often depends on income; government policies can alter this distribution.
Types of Economic Systems
Centrally Planned Economy: Government decides how resources are allocated.
Market Economy: Households and firms interacting in markets allocate resources.
Mixed Economy: Most decisions are made in markets, but government plays a significant role.
Efficiency and Equity
Productive Efficiency: Goods and services produced at lowest possible cost (due to competition).
Allocative Efficiency: Production matches consumer preferences; each good is produced up to the point where marginal benefit equals marginal cost.
Voluntary Exchange: Both buyer and seller are made better off by the transaction.
Equity: The fair distribution of economic benefits, which may conflict with efficiency.
1.3 Economic Models
Building and Testing Economic Models
Steps in model building:
Decide on assumptions.
Formulate a testable hypothesis.
Use data to test the hypothesis.
Revise the model if necessary.
Retain the revised model for future analysis.
Assumptions: Simplify reality to focus on key relationships (e.g., consumers maximize well-being, firms maximize profit).
Economic Variable: Something measurable that can have different values (e.g., employment, price).
Positive Analysis: What is (fact-based).
Normative Analysis: What ought to be (value-based).
1.4 Microeconomics and Macroeconomics
Distinguishing Microeconomics and Macroeconomics
Microeconomics: Study of how households and firms make choices, interact in markets, and how government influences them.
Macroeconomics: Study of the economy as a whole, including inflation, unemployment, and economic growth.
Microeconomic Issues | Macroeconomic Issues |
|---|---|
How consumers react to price changes | Why economies experience recessions |
How firms set prices | What determines inflation rate |
Reducing opioid addiction efficiently | What determines the value of the dollar |
Effect of AI on costs and employment | Whether government can reduce recessions |
1.5 Economic Skills and Economics as a Career
Skills Gained from Studying Economics
Ability to analyze choices and consequences for individuals, firms, and governments.
Application of economic models to real-world problems.
Critical thinking and quantitative analysis.
Company/Organization | What an Economist Might Do |
|---|---|
Ford Motor Company | Forecast demand for electric cars |
Goldman Sachs | Forecast interest rates |
McDonald's | Decide on opening new restaurants |
Pfizer | Analyze costs and benefits of new treatments |
Wall Street Journal | Interpret monetary policy |
Federal Reserve Bank | Forecast employment trends |
Federal Trade Commission | Analyze mergers |
World Bank | Evaluate development programs |
Appendix: Using Graphs and Formulas
Graphs in Economics
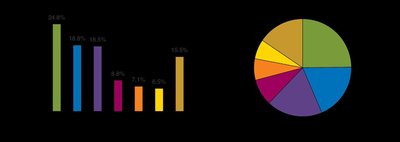
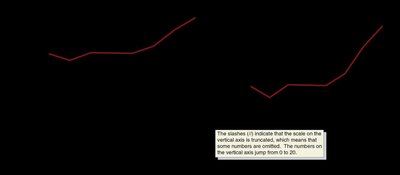
Graphs are visual tools that help illustrate economic relationships and trends. Common types include bar graphs, pie charts, and time-series graphs.
Plotting Economic Data
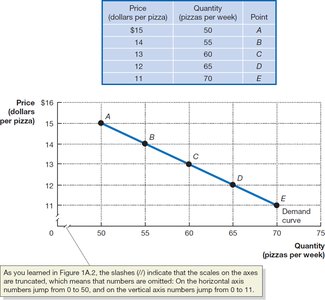
Graphs often plot price on the vertical axis (y-axis) and quantity on the horizontal axis (x-axis). Each point represents a price-quantity combination, and connecting points shows the relationship between variables.
Calculating Slope
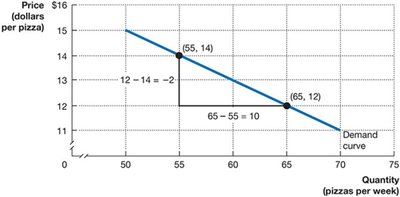
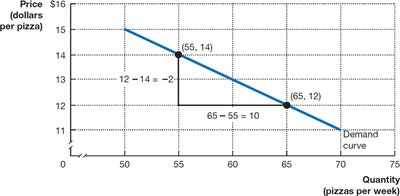
The slope of a line is calculated as the change in the y-axis variable divided by the change in the x-axis variable. For a straight line, the slope is constant.
Formula:
Example: If price decreases from \frac{-2}{10} = -0.2$
Shifting Curves and Multiple Variables
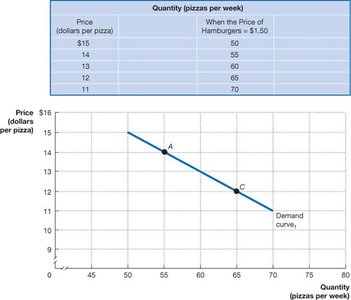
Graphs can show how changes in a third variable (e.g., price of a related good) shift the demand curve.
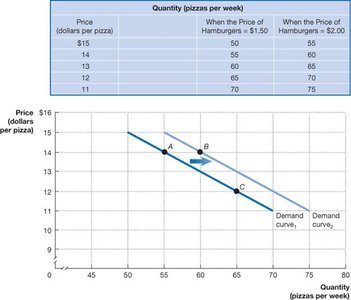
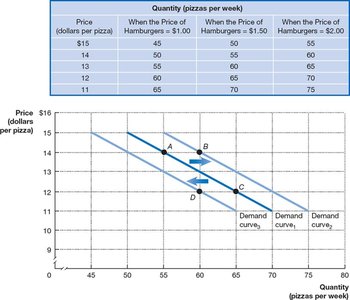
Positive and Negative Relationships
A positive relationship means both variables move in the same direction; a negative relationship means they move in opposite directions.
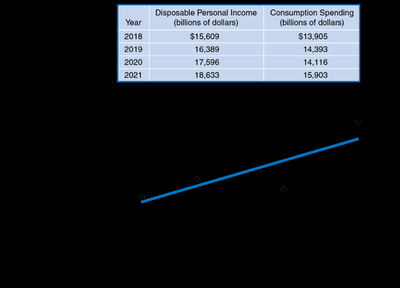
Cause and Effect in Graphs
Graphs can illustrate relationships but do not always prove causality. Problems include omitted variables and reverse causality.
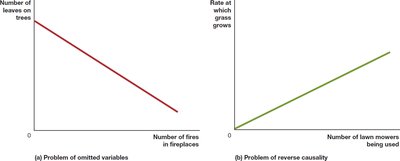
Linear vs. Nonlinear Relationships
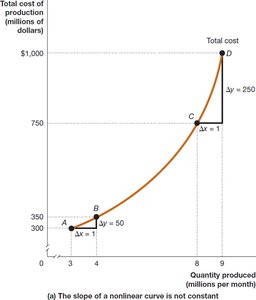
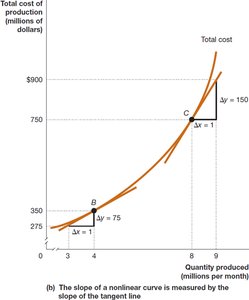
Most economic relationships are not perfectly linear. The slope of a nonlinear curve varies at different points and can be approximated by the slope of a tangent line.
Formulas in Economics
Percentage Change:
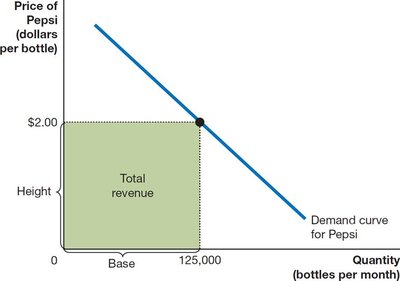
Area of a Rectangle: (used for total revenue)
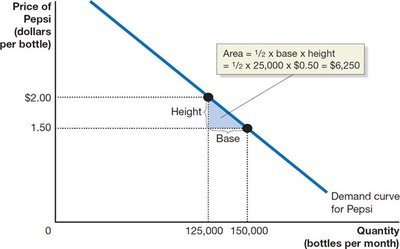
Area of a Triangle:
Steps for Using Formulas
Understand the economic concept the formula represents.
Use the correct formula for the problem.
Check that the result is economically reasonable.
Additional info: These notes cover the foundational concepts of economics, including the use of models, the distinction between microeconomics and macroeconomics, and the application of graphs and formulas in economic analysis. The included images reinforce key graphical concepts and calculations essential for introductory macroeconomics.
