 뒤로
뒤로Macroeconomics Exam Study Guide: Key Concepts, Tables, and Problem-Solving Practice
스터디 가이드 - 스마트 노트
 자료에 맞춘 맞춤형 노트, 핵심 정의, 예시, 맥락을 확장해 제공합니다.
Q1. Opportunity Cost and Comparative Advantage: Saudi Arabia and United States
Background
Topic: Production Possibilities Frontier (PPF), Opportunity Cost, Absolute and Comparative Advantage
This question tests your understanding of how to calculate opportunity costs, and how to determine which country has an absolute or comparative advantage in producing certain goods. These concepts are foundational for understanding gains from trade and the rationale for specialization in international economics.
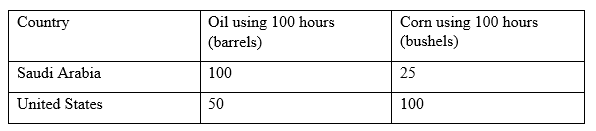
Key Terms and Formulas:
Opportunity Cost: The value of the next best alternative foregone when making a choice.
Absolute Advantage: The ability to produce more of a good with the same resources than another producer.
Comparative Advantage: The ability to produce a good at a lower opportunity cost than another producer.
To calculate opportunity cost for each good, use the formula:
Step-by-Step Guidance
For Saudi Arabia, calculate the opportunity cost of producing 1 barrel of oil and 1 bushel of corn using the table values.
Repeat the calculation for the United States for both goods.
Compare the maximum outputs to determine who has the absolute advantage in oil and corn production.
Compare the opportunity costs to determine who has the comparative advantage in each good.
Set up your answers but stop before writing the final values.
Try solving on your own before revealing the answer!
Final Answers:
Saudi Arabia's opportunity cost of producing 1 barrel of oil is 0.25 bushels of corn; for 1 bushel of corn, it is 4 barrels of oil.
United States' opportunity cost of producing 1 barrel of oil is 2 bushels of corn; for 1 bushel of corn, it is 0.5 barrels of oil.
Absolute advantage in oil: Saudi Arabia; in corn: United States.
Comparative advantage in oil: Saudi Arabia; in corn: United States.
Saudi Arabia gives up less corn per barrel of oil, and the U.S. gives up less oil per bushel of corn, so each should specialize accordingly.
Q2. Complete Specialization and Gains from Trade Table
Background
Topic: Specialization, Gains from Trade, Consumption Possibilities
This question asks you to fill in a table showing production, trade, and consumption for Saudi Arabia and the United States, both with and without trade. It demonstrates how countries can benefit from specializing in the good for which they have a comparative advantage and then trading.
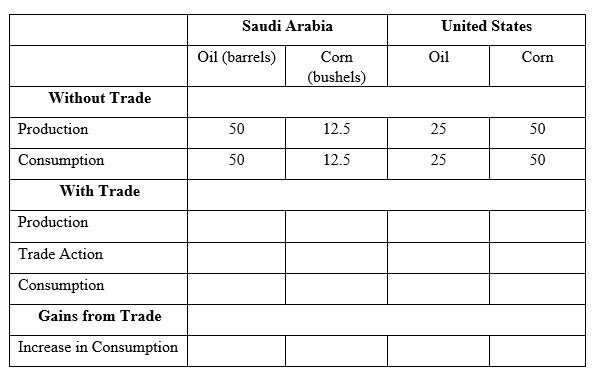
Key Terms and Formulas:
Specialization: Focusing resources on the production of one good where a country has a comparative advantage.
Gains from Trade: The increase in consumption possible due to specialization and exchange.
Step-by-Step Guidance
Identify which good each country should specialize in based on comparative advantage (from Q1).
Fill in the 'With Trade' production row: each country produces only the good in which it specializes.
Determine the trade action (e.g., how much of each good is traded between countries).
Calculate each country's consumption after trade by adding imports to their own production and subtracting exports.
Set up the calculation for the increase in consumption (gains from trade) but do not compute the final values yet.
Try solving on your own before revealing the answer!
Final Answers:
With specialization, Saudi Arabia produces only oil (100 barrels), and the U.S. produces only corn (100 bushels).
If Saudi Arabia trades 45 barrels of oil for 40 bushels of corn, after trade and consumption, both countries can consume more of both goods than without trade.
Gains from trade are the increases in consumption for each country compared to the 'Without Trade' scenario.
This demonstrates the mutual benefits of trade based on comparative advantage.
Q3. Supply and Demand Schedule: Equilibrium, Shortage, and Surplus
Background
Topic: Market Equilibrium, Shortage, Surplus
This question provides a supply and demand schedule and asks you to graph the curves, identify the equilibrium price and quantity, and determine if there is a shortage or surplus at each price.
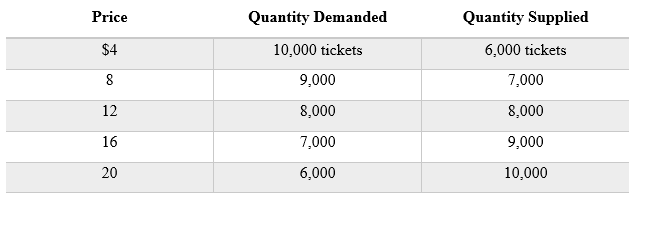
Key Terms and Formulas:
Equilibrium Price: The price at which quantity demanded equals quantity supplied.
Shortage: Quantity demanded > quantity supplied at a given price.
Surplus: Quantity supplied > quantity demanded at a given price.
Step-by-Step Guidance
Plot the quantity demanded and quantity supplied at each price on a graph (price on the vertical axis, quantity on the horizontal axis).
Identify the price where quantity demanded equals quantity supplied (equilibrium).
For each price, calculate the difference between quantity demanded and quantity supplied to determine if there is a shortage or surplus.
Label the equilibrium point and indicate the presence of shortages or surpluses at other prices.
Set up the table or graph but do not state the equilibrium price/quantity yet.
Try solving on your own before revealing the answer!
Final Answers:
Equilibrium occurs at $12, where quantity demanded and supplied are both 8,000 tickets.
At prices below equilibrium, there is a shortage; at prices above, a surplus.
For example, at $4, shortage of 4,000 tickets; at $20, surplus of 4,000 tickets.
The equilibrium price and quantity are where the market clears, and shortages/surpluses indicate disequilibrium.
Q4. Calculating CPI and Inflation Rate Using a Basket of Goods
Background
Topic: Consumer Price Index (CPI), Inflation Rate
This question provides price and quantity data for milk and honey over three years. You are asked to calculate the CPI for 2014 and 2015 using 2013 as the base year, and then compute the inflation rate from 2014 to 2015.
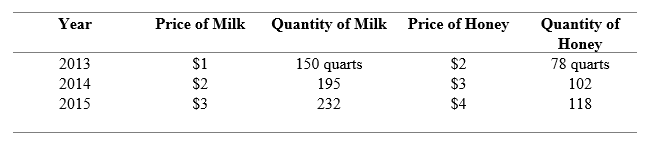
Key Terms and Formulas:
Consumer Price Index (CPI): Measures the average change in prices paid by consumers for a fixed basket of goods and services.
Inflation Rate: The percentage change in the CPI from one year to the next.
Key formulas:
Step-by-Step Guidance
Calculate the cost of the basket (100 quarts of milk and 50 quarts of honey) for each year using the given prices.
Compute the CPI for 2014 and 2015 using 2013 as the base year.
Use the CPI values to set up the calculation for the inflation rate from 2014 to 2015.
Stop before plugging in the final numbers for the inflation rate.
Try solving on your own before revealing the answer!
Final Answers:
Cost of basket in 2013: $2 \times 100 + $2 \times 50 = $200 + $100 = $300
Cost of basket in 2014: $3 \times 100 + $4 \times 50 = $300 + $200 = $500
Cost of basket in 2015: $5 \times 100 + $5 \times 50 = $500 + $250 = $750
CPI 2014 =
CPI 2015 =
Inflation rate from 2014 to 2015 =
This shows how the CPI and inflation rate are calculated using a fixed basket of goods.
