 뒤로
뒤로Macroeconomics Study Guide: GDP, Jobs, Inflation, and Economic Growth
스터디 가이드 - 스마트 노트
 자료에 맞춘 맞춤형 노트, 핵심 정의, 예시, 맥락을 확장해 제공합니다.
Chapter 4: GDP - Monitoring the Value of Production
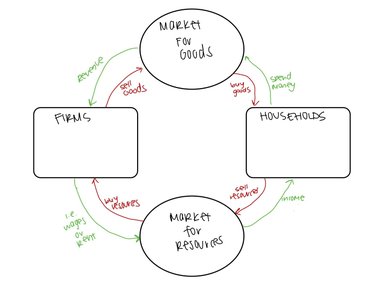
Circular Flow Diagram
The circular flow diagram is a fundamental model in macroeconomics that illustrates the interactions between households, firms, and markets for goods and resources. It shows how money and resources move through the economy.
Households: Own resources (factors of production), buy goods and services, sell resources.
Firms: Produce goods and services, buy resources, sell goods and services.
Market for Goods: Where goods and services are bought and sold.
Market for Resources: Where resources (labor, capital, land) are bought and sold.
Gross Domestic Product (GDP)
GDP is the value of all final goods and services produced within a country in a year. It is a key measure of productivity and economic health.
Expenditure Approach: GDP is calculated as the sum of all expenditures in the economy.
Formula:
C (Consumption): Spending by households on goods and services (services, nondurable goods, durable goods).
I (Investment): Spending on capital equipment, inventory, and structures. Financial transactions are not included.
G (Government Spending): Spending by government on goods and services (excludes transfer payments).
NX (Net Exports): Exports minus imports.
Income Approach: Adds up all components of national income and adjusts for net foreign factor income, depreciation, and statistical discrepancy.
Nominal vs. Real GDP
Nominal GDP: Uses current prices for calculation.
Real GDP: Uses base year prices to remove effects of inflation.
GDP Deflator and Inflation Rate
GDP Deflator Formula:
Inflation Rate Formula:
Shortcomings of GDP
Does not account for distribution of income, leisure, non-market production, underground economy, or negative byproducts.
Other Measures
Gross National Product (GNP): Value of goods and services produced by a country's citizens, including abroad.
Net Domestic Product (NDP):
Personal Income: Income received by households, including transfer payments.
Disposable Personal Income: Income after taxes, available for consumption or savings.
Chapter 5: Monitoring Jobs and Inflation
Labor Force and Unemployment
The labor force consists of all working-aged individuals who are either employed or actively seeking employment. Unemployment occurs when individuals are searching for work but cannot find a job.
Unemployment Rate Formula:
Labor Force Participation Rate:
Types of Unemployment:
Frictional: Short-term, from job search and matching.
Structural: Long-term, from mismatch of skills and jobs.
Cyclical: Caused by business cycle recessions.
Full Employment: Occurs when cyclical unemployment is zero; actual GDP equals potential GDP.
GDP Gap:
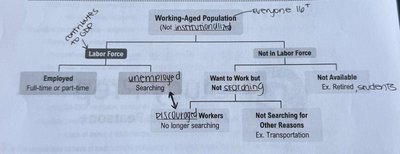
Problems with Measuring Unemployment
Discouraged workers are not counted, leading to understatement.
Part-time workers counted as fully employed, leading to partial understatement.
Survey inaccuracies can distort unemployment statistics.
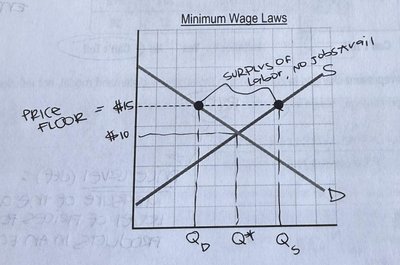
Minimum Wage Laws and Price Floors
Minimum wage laws set a price floor above equilibrium, causing a surplus of labor (unemployment).
Inflation and Price Level
Inflation: General and sustained rise in prices across the economy.
Price Level: Measure of overall prices for all products.
Inflation Rate Formula:
Consumer Price Index (CPI)
The CPI measures the average change in prices of a typical family's basket of goods.
CPI Formula:
Inflation using CPI:
Converting Dollars:
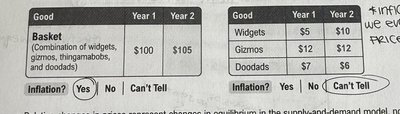
Problems with CPI
Substitution Bias: CPI understated as consumers switch to cheaper alternatives.
New Goods Bias: CPI overstated as new goods are added.
Quality Bias: CPI can be understated or overstated depending on quality changes.
Chapter 6: Economic Growth
Economic Growth and Productivity
Economic growth is the increase in real output per capita, leading to higher living standards. Productivity is determined by physical capital, human capital, and technology.
Annual Growth Rate Formula:
Average Annual Growth Rate:
Rule of 70:
Productivity: Output per unit of labor, determined by capital, human capital, and technology.
Per-Worker Production Function and Diminishing Returns
The per-worker production function shows the relationship between capital per worker and output per hour worked. Diminishing returns mean each additional unit of capital yields smaller increases in output.
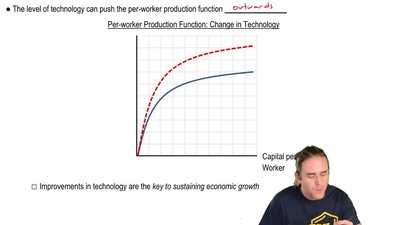
Technological improvements shift the production function outward, increasing productivity.
Catch-Up Effect and Growth Theory
Catch-Up Effect: Developing countries grow faster by adopting technologies from developed countries.
New Growth Theory: Technological change is the key driver of productivity growth. Knowledge capital has increasing returns and is a public good.
Government Policies for Growth
Public education, health, property rights, savings and investment, free trade, and support for research and development stimulate economic growth.
Summary Table: Types of Unemployment
Type | Description | Duration |
|---|---|---|
Frictional | Short-term, job search | Temporary |
Structural | Mismatch of skills/jobs | Long-term |
Cyclical | Business cycle recession | Varies |
Summary Table: GDP Calculation Approaches
Approach | Components |
|---|---|
Expenditure | C, I, G, NX |
Income | Compensation, rents, interest, profits, taxes |
