 뒤로
뒤로Chapter 5
스터디 가이드 - 스마트 노트
 자료에 맞춘 맞춤형 노트, 핵심 정의, 예시, 맥락을 확장해 제공합니다.
Monitoring Jobs and Inflation
Introduction
This chapter explores how economists monitor the labor market and inflation, two critical indicators of macroeconomic health. Understanding employment, unemployment, and price level changes is essential for analyzing economic performance and policy.
Labor Market Measurement and Importance
Income and Labor in GDP
GDP can be measured by summing all sources of income: wages (labor), rent (land), interest (capital), and profit (entrepreneurship).
Wages constitute the largest share of US income, highlighting the importance of labor in the economy.
Changes in the labor market significantly affect overall economic performance.
Why Unemployment is Harmful
Unemployment reduces individual income and overall consumption, leading to lower economic growth.
Work provides experience and increases human capital; unemployment results in lost opportunities for skill development.

Measuring Unemployment: The CPS
The Current Population Survey (CPS)
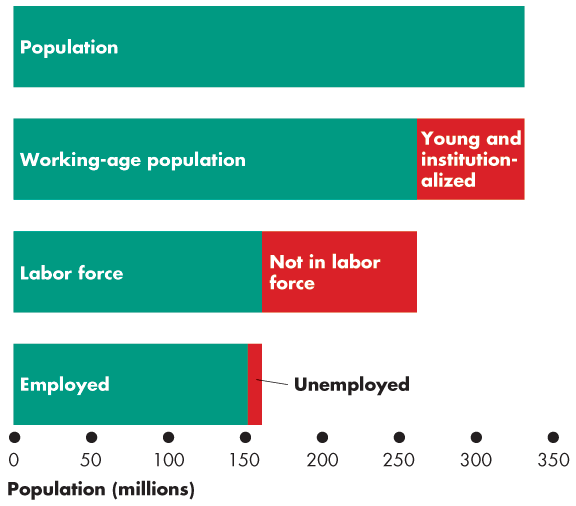
The CPS is a monthly survey of about 60,000 US households, used to classify the population for labor market statistics.
Excludes individuals under 16 and those in institutions (e.g., hospitals, jails).
Classifying the US Population
Working-age population: All people 16 and older, not institutionalized.
Labor force: People in the working-age population who are either employed or actively seeking work.
Those not working and not seeking work are not in the labor force.
Employed: People with jobs.
Unemployed: People without jobs who have actively sought work in the past 4 weeks, are waiting to be recalled from a layoff, or will start a new job within 30 days.
Labor Market Statistics
Key Indicators
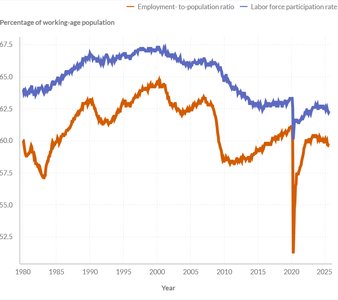
Unemployment rate:
Employment-to-population ratio:
Labor force participation rate:
Labor Market Classifications
Marginally attached workers: Not in the labor force, want a job, but have not searched in the past 4 weeks.
Discouraged workers: Marginally attached workers who stopped searching due to repeated failure.
Economic part-time workers: Employed part-time but want full-time work; not classified as unemployed.
Types of Unemployment
Frictional Unemployment
Results from normal labor market turnover (e.g., job search, switching jobs, retirement).
Considered healthy for the economy as it reflects mobility and matching of skills to jobs.
Structural Unemployment
Caused by changes in the structure of the economy (e.g., technological change, outsourcing).
Requires workers to gain new skills or relocate; typically lasts longer than frictional unemployment.
Cyclical Unemployment
Results from fluctuations in the business cycle (e.g., recessions and expansions).
Increases during recessions, decreases during expansions.

Natural Unemployment and the Business Cycle
Natural Unemployment Rate
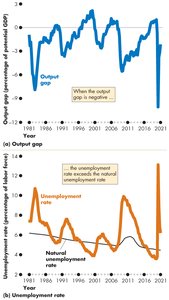
The unemployment rate when cyclical unemployment is zero (i.e., at full employment).
Can change over time due to demographics, technology, or policy changes (e.g., more generous unemployment benefits).
Output Gap
Potential GDP: Output when the economy is at full employment.
Output gap: Difference between real GDP and potential GDP.
If unemployment rate > natural rate: real GDP < potential GDP (negative output gap).
If unemployment rate < natural rate: real GDP > potential GDP (positive output gap).
Inflation and the Price Level
Understanding the Price Level
Price level: The average level of prices for all goods and services in the economy.
Inflation: A persistent rise in the price level.
Deflation: A persistent fall in the price level.
Effects of Unexpected Inflation and Deflation
Unexpected inflation redistributes income and wealth (e.g., workers and lenders lose, employers and borrowers gain).
Unexpected deflation has the opposite effect.
Both can lower real GDP and employment, and divert resources from productive activities to managing money.

Hyperinflation
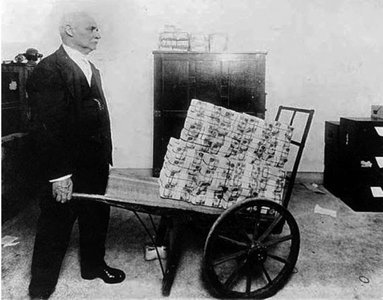
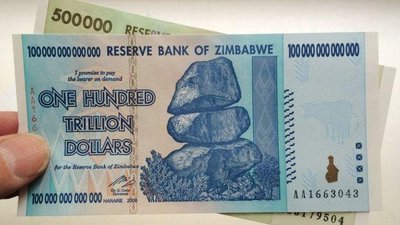
Hyperinflation: Inflation rate ≥ 50% per month.
Severely disrupts economic activity and erodes the value of money.
The Consumer Price Index (CPI)
Definition and Construction
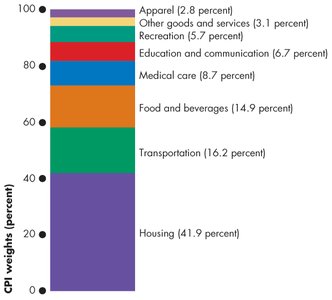
The CPI measures the average price of a fixed basket of goods and services purchased by urban households.
Calculated as:
The CPI basket is based on the spending patterns of the base year.
Calculating the Inflation Rate
CPI inflation rate:
Problems with the CPI
New goods bias: New products may not be included promptly.
Quality change bias: Improvements in product quality may be misinterpreted as price increases.
Commodity substitution bias: Consumers may substitute cheaper goods, but the CPI basket is fixed.
Outlet substitution bias: Shifts to discount retailers are not reflected in the CPI.
These biases cause the CPI to overestimate actual inflation.



Measuring Inflation Without Volatility
Core Inflation
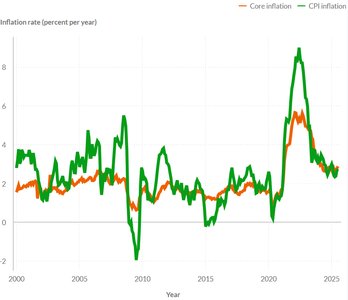
Food and energy prices are highly volatile, making the CPI inflation rate fluctuate.
The Personal Consumption Expenditures (PCE) index is an alternative measure, and core inflation excludes food and energy for a smoother trend.
Real vs. Nominal Values
Adjusting for Price Changes
To compare values over time, adjust nominal values for changes in the price level to obtain real values.
Formula:
Example:
