 뒤로
뒤로Monitoring Jobs and Inflation: Labor Market and Price Level in Macroeconomics
스터디 가이드 - 스마트 노트
 자료에 맞춘 맞춤형 노트, 핵심 정의, 예시, 맥락을 확장해 제공합니다.
Monitoring Jobs and Inflation
Introduction
This chapter explores how economists monitor the labor market and inflation, two critical indicators of macroeconomic health. Understanding employment, unemployment, and price level changes is essential for analyzing economic performance and policy decisions.
Labor Market: Measuring Jobs and Unemployment
Income and the Labor Market
GDP and Income: Gross Domestic Product (GDP) can be measured by summing all sources of income: wages (labor), rent (land), interest (capital), and profit (entrepreneurship).
Wages: The majority of U.S. income comes from wages, highlighting the importance of labor in the economy.
Labor Market Impact: Changes in the labor market significantly affect overall economic performance.
Why is Unemployment Bad?
Personal Cost: Unemployment reduces individual income and well-being.
Economic Cost: High unemployment leads to lower consumption today and less economic growth in the future due to lost experience and human capital.
Human Capital: Work experience increases human capital, so unemployment represents a loss of potential skills and productivity.

Measuring Unemployment: The Current Population Survey (CPS)
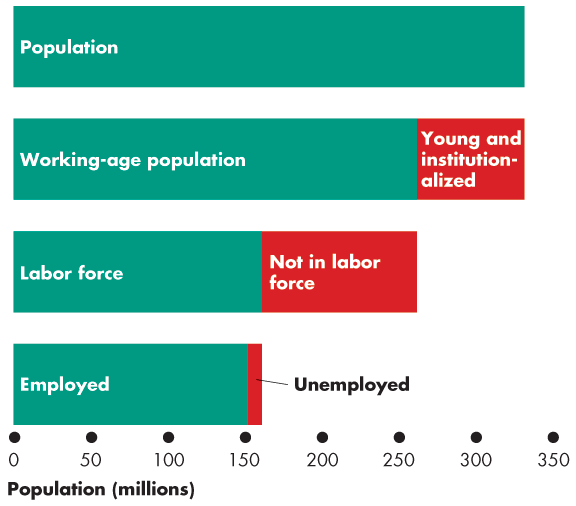
CPS: A monthly survey of about 60,000 U.S. households used to classify the population for labor market statistics.
Population Classification: The survey divides the population into several categories to measure labor market activity.
Classifying the U.S. Population
Working-Age Population: Total population minus those under 16 or in institutions (e.g., hospitals, jails).
Labor Force: Working-age individuals who are either employed or actively seeking work.
Not in Labor Force: Working-age individuals not working and not seeking work.
Employed: People in the labor force who have jobs.
Unemployed: People in the labor force without jobs but actively seeking work.
Definition of Unemployment
Unemployed: No job, but has searched for work in the last 4 weeks, or is laid off and waiting to be recalled, or has a new job starting soon.
Not in Labor Force: Wants a job but has not searched in the last 4 weeks.
Labor Market Statistics
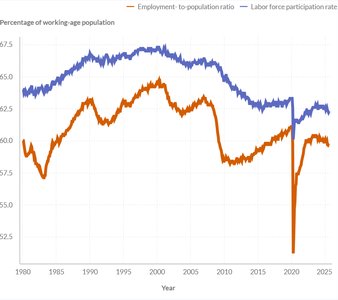
Unemployment Rate:
Employment-to-Population Ratio:
Labor Force Participation Rate:
Special Labor Market Categories
Marginally Attached Workers: Want a job, ready to work, but have not searched in the last 4 weeks (not in labor force).
Discouraged Workers: Marginally attached workers who stopped searching due to repeated failure.
Economic Part-Time Workers: Employed part-time but want full-time work (counted as employed, not unemployed).
Types of Unemployment
Three Reasons for Being Unemployed
Frictional Unemployment: Short-term unemployment from normal labor market turnover (e.g., job search, switching jobs, retirement).
Structural Unemployment: Unemployment due to changes in the economy, such as new technology or shifting industries, requiring new skills or relocation.
Cyclical Unemployment: Unemployment caused by economic downturns (recessions) or expansions.

Natural Unemployment and Full Employment
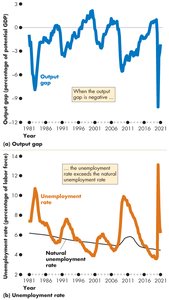
Natural Unemployment Rate: The unemployment rate when cyclical unemployment is zero (i.e., only frictional and structural unemployment exist).
Full Employment: The state when the actual unemployment rate equals the natural unemployment rate.
Factors Affecting Natural Rate: Demographics, technological change, and unemployment benefits can shift the natural rate over time.
Unemployment and the Business Cycle
Potential GDP: The level of GDP when the economy is at full employment.
Output Gap: The difference between real GDP and potential GDP.
Output Gap Equation:
Interpretation:
Negative output gap: Real GDP < Potential GDP (high unemployment)
Positive output gap: Real GDP > Potential GDP (low unemployment)
Inflation and the Price Level
Why Prices Matter
Price Level: The average level of prices for all goods and services in the economy.
Inflation: A persistent rise in the price level.
Deflation: A persistent fall in the price level.
Economic Impact: Unexpected inflation or deflation can redistribute income and wealth, lower real GDP, and divert resources from productive activities.
Effects of Unexpected Inflation and Deflation
Redistribution of Income: Fixed contracts (e.g., wages) lose value with unexpected inflation, benefiting employers and harming workers.
Redistribution of Wealth: Loans are repaid with money worth less (inflation) or more (deflation) than expected, affecting lenders and borrowers.

Lower Real GDP and Employment: Unexpected inflation can temporarily boost real GDP, but often leads to a larger subsequent decline. Deflation reduces spending and output.
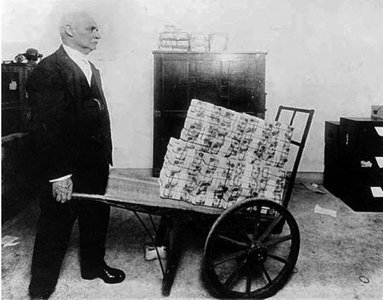
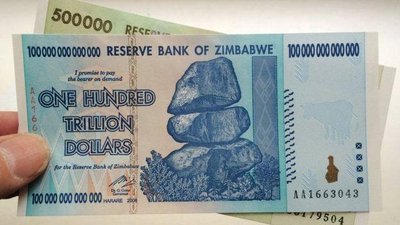
Resource Diversion: High inflation (especially hyperinflation, defined as inflation ≥ 50% per month) forces people to spend time managing money instead of producing goods and services.
Measuring the Price Level: The Consumer Price Index (CPI)
What is the CPI?
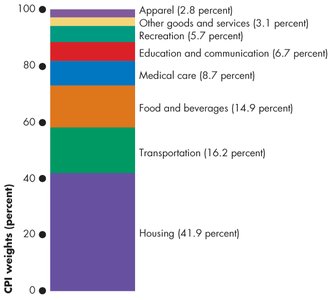
Consumer Price Index (CPI): Measures the average price of a fixed basket of goods and services purchased by an average urban household.
Purpose: Tracks changes in the cost of living over time.
Calculating the CPI
CPI Formula:
CPI Inflation Rate:
Problems with the CPI
New Goods Bias: New products may not be included promptly.
Quality Change Bias: Improvements in product quality may be misinterpreted as price increases.
Commodity Substitution Bias: Consumers may switch to cheaper alternatives, but the CPI basket is fixed.
Outlet Substitution Bias: Shifts to discount retailers are not always captured.
Result: The CPI tends to overestimate actual inflation.



Measuring Inflation Without Volatility
Core Inflation and the PCE Index
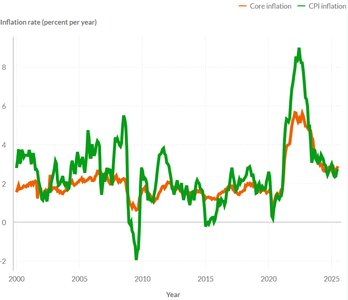
Volatility: Food and energy prices are highly volatile, making overall CPI inflation fluctuate.
PCE Index: The Personal Consumption Expenditures (PCE) index is an alternative measure of the price level, using a different basket of goods and services.
Core Inflation Rate: Excludes food and energy prices to provide a less volatile measure of underlying inflation trends.
Real vs. Nominal Values
Adjusting for Price Changes
Nominal Value: Measured in current dollars, not adjusted for inflation.
Real Value: Adjusted for changes in the price level, reflecting purchasing power.
Formula:
Example: Real wage rate = (Nominal wage rate / CPI) × 100
