 뒤로
뒤로Monitoring Jobs, Inflation, and Economic Growth: Core Concepts in Macroeconomics
스터디 가이드 - 스마트 노트
 자료에 맞춘 맞춤형 노트, 핵심 정의, 예시, 맥락을 확장해 제공합니다.
Monitoring Jobs and Inflation
The Importance of Labor in the Economy
Labor is a critical component of economic activity, as it is the primary source of income for most households and a major determinant of overall economic health. Changes in the labor market can have significant effects on both current consumption and future economic growth.
Wages are the largest component of income in the U.S. economy.
Unemployment reduces both present consumption and the accumulation of human capital, which is the knowledge and skills gained through work experience.

Measuring Unemployment: The Current Population Survey (CPS)
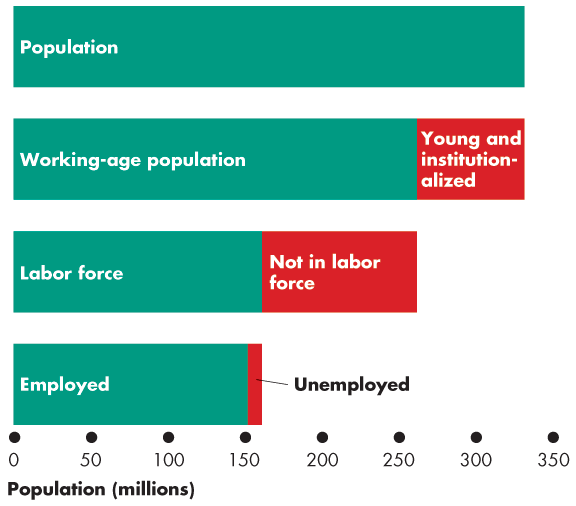
The U.S. labor market is monitored using the CPS, a monthly survey that classifies individuals into categories based on age, institutionalization, and labor market activity.
Working-age population: All individuals aged 16 and over, not in institutions.
Labor force: Those in the working-age population who are either employed or actively seeking work.
Employed: Individuals with jobs.
Unemployed: Individuals without jobs who have actively searched for work in the past four weeks, are waiting to be recalled from a layoff, or are starting a new job soon.
Labor Market Statistics
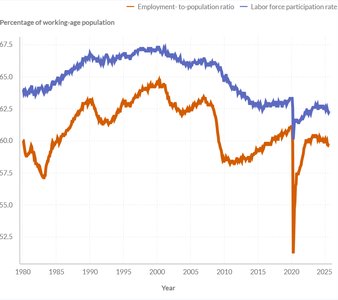
Economists use several indicators to assess the health of the labor market:
Unemployment rate:
Employment-to-population ratio:
Labor force participation rate:
Categories of Non-Employment
Marginally attached workers: Individuals who want a job but have not searched in the past four weeks.
Discouraged workers: Marginally attached workers who have stopped searching due to repeated failure.
Economic part-time workers: Individuals working part-time who desire full-time employment.
Types of Unemployment
Unemployment is not always harmful; it can result from normal labor market turnover or structural changes in the economy.
Frictional unemployment: Short-term unemployment from job searching or transitions.
Structural unemployment: Unemployment due to changes in the skills required or job locations.
Cyclical unemployment: Unemployment caused by economic downturns (recessions).
Natural Unemployment and the Business Cycle
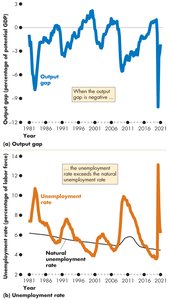
Natural unemployment rate: The unemployment rate when cyclical unemployment is zero (i.e., at full employment).
Output gap: The difference between real GDP and potential GDP.
When the unemployment rate is above the natural rate, real GDP is below potential GDP (negative output gap). When it is below, real GDP exceeds potential GDP (positive output gap).
Monitoring Prices: Inflation and Deflation
The Price Level and Its Importance
The price level is the average of current prices across the entire spectrum of goods and services produced in the economy. Persistent increases in the price level are called inflation, while persistent decreases are called deflation.
Effects of Unexpected Inflation and Deflation
Redistribution of income: Contracts and wages may lose value if inflation is higher than expected.
Redistribution of wealth: Loans are repaid with money that may be worth less (inflation) or more (deflation) than anticipated.
Lower real GDP and employment: Unexpected inflation or deflation can disrupt economic activity.
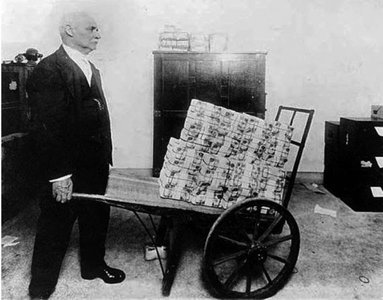
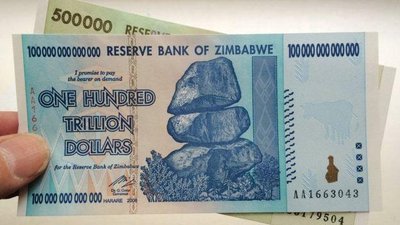
Resource diversion: High inflation (especially hyperinflation, defined as inflation ≥ 50% per month) forces people to spend time managing money rather than producing goods and services.

The Consumer Price Index (CPI)
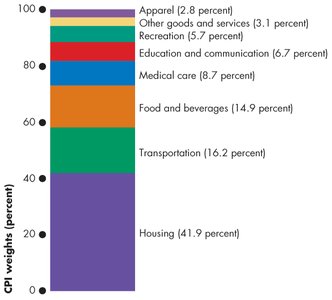
The CPI measures the average change in prices paid by urban consumers for a fixed basket of goods and services. It is used to track inflation over time.
CPI calculation:
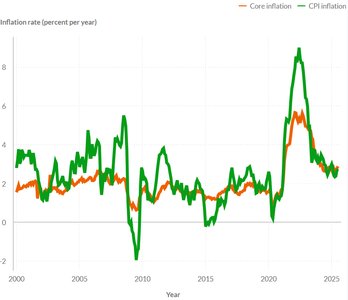
CPI inflation rate:
Problems with the CPI
New goods bias: New products are not immediately included in the basket.
Quality change bias: Improvements in product quality are not fully accounted for.
Commodity substitution bias: Consumers may substitute cheaper goods, but the basket is fixed.
Outlet substitution bias: Shifts to discount retailers are not reflected.
These biases generally cause the CPI to overstate the true rate of inflation.



Measuring Inflation Without Volatility
Food and energy prices are highly volatile. The core inflation rate (often measured by the Personal Consumption Expenditures (PCE) index excluding food and energy) provides a less volatile measure of underlying inflation trends.
Real vs. Nominal Values
To compare economic values over time, it is necessary to adjust for changes in the price level:
Real value:
Example:
Monitoring the Value of Production: GDP
Gross Domestic Product (GDP): Definition and Components
GDP is the market value of all final goods and services produced within a country in a given period. It is the primary measure of a nation's economic output and wealth.
Market value: Goods and services are valued at market prices.
Final goods: Only goods purchased by their final users are counted; intermediate goods are excluded to avoid double counting.
Domestic production: Only goods produced within the country's borders are included.
Time period: GDP is measured over a specific interval, usually a quarter or a year.
Final vs. Intermediate Goods
Only the value of final goods is included in GDP to prevent double counting. Intermediate goods are used as inputs in the production of final goods.


GDP Calculation Approaches
Expenditure approach: GDP is the sum of all expenditures on final goods and services.
Income approach: GDP is the sum of all incomes earned in the production of goods and services.
Expenditure approach formula:
Where: C = Consumption expenditure I = Investment G = Government expenditure X = Exports M = Imports
Nominal vs. Real GDP
Nominal GDP: Values output using current prices.
Real GDP: Values output using prices from a base year, allowing for comparison over time.
To calculate real GDP, use the quantities from the year being measured and the prices from the base year.
GDP per Person and Potential GDP
Real GDP per person:
Potential GDP: The highest level of GDP that can be sustained over the long term without increasing inflation.
The Business Cycle
The business cycle describes the fluctuations of real GDP around potential GDP:
Expansion: Real GDP increases.
Peak: Real GDP reaches a temporary high.
Recession: Real GDP decreases.
Trough: Real GDP reaches a temporary low.
Comparing GDP Across Countries
Direct comparisons using exchange rates can be misleading due to differences in price levels.
Purchasing Power Parity (PPP) adjusts for price differences, providing a better measure of relative living standards.
Limitations of Real GDP
Excludes household production, underground economic activity, leisure, environmental quality, and new goods not present in the base year.
Alternative measures include the Human Development Index, Green Net National Product, and Happiness Index.
Economic Growth
Measuring Economic Growth
Growth rate of real GDP:
Growth rate of real GDP per person: Growth rate of real GDP minus growth rate of population
Rule of 70: Years to double =
Sources of Economic Growth
Growth of the supply of labor: Driven by increases in average hours worked, employment-to-population ratio, and working-age population.
Growth of labor productivity: Real GDP per labor hour; increases allow more output with the same input.
Determinants of Labor Productivity Growth
Physical capital growth: More machines and tools.
Human capital growth: More knowledge and expertise.
Technological advances: New ideas and methods.
Theories of Economic Growth
Classical growth theory: Growth is temporary; population growth offsets gains in living standards (Malthusian theory).
Neoclassical growth theory: Long-run growth depends on technological progress, which occurs randomly.
New growth theory: Technological progress results from intentional investment in knowledge, which is a public good and not subject to diminishing returns.
Additional info: These theories help explain why some countries grow faster than others and inform policy decisions aimed at promoting sustainable economic growth.
