 뒤로
뒤로Chapter 4
스터디 가이드 - 스마트 노트
 자료에 맞춘 맞춤형 노트, 핵심 정의, 예시, 맥락을 확장해 제공합니다.
Monitoring the Value of Production: GDP
The Challenge of Macroeconomics
Macroeconomics seeks to measure the total production of all goods and services in a country within a given period. Unlike microeconomics, which focuses on individual markets, macroeconomics must aggregate diverse products—such as apples, oranges, smartphones, and cars—into a single measure. This aggregation is accomplished through the concept of Gross Domestic Product (GDP).
Microeconomics: Examines individual markets (e.g., apples).
Macroeconomics: Aggregates all markets to measure total production.
Key Challenge: Combining different goods and services into one value.
Gross Domestic Product (GDP): Definition and Components
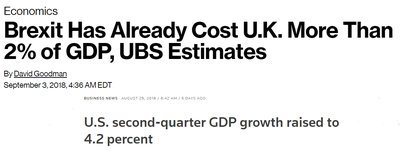
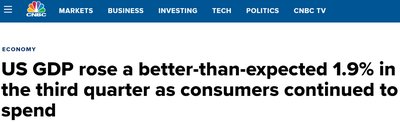
Gross Domestic Product (GDP) is the market value of all final goods and services produced within a country in a given time period. It is the most widely used measure of a country's productivity and wealth.
Market Value: The prices at which items are traded in markets.
Final Goods: Goods bought by their final user during a specified period.
Intermediate Goods: Goods used as components in the production of final goods (not counted in GDP to avoid double counting).
Domestic Production: Only goods produced within the country are included.
Time Period: GDP is measured over a specific period, usually a quarter or a year.
Example: Counting Only Final Goods
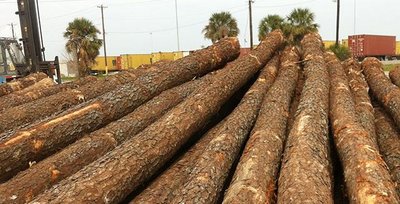
Bob the Lumberjack sells a log to Lumber Co for $1 (intermediate good).
Lumber Co turns the log into plywood, sold for $10 (intermediate good).
Christine uses the plywood to make a cornhole board, sold for $100 (final good).
Only the value of the cornhole board ($100) counts toward GDP.

GDP: Domestic and Time-Bound
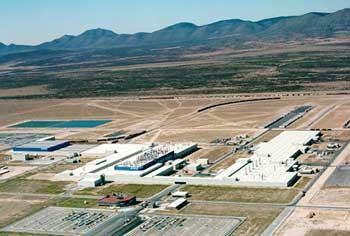
Domestic: Goods produced within the US count toward US GDP; goods produced in Mexico count toward Mexico's GDP.
Time Period: GDP is measured for a specific period (quarterly or annually).



The Circular Flow of Expenditure and Income
Understanding the Circular Flow
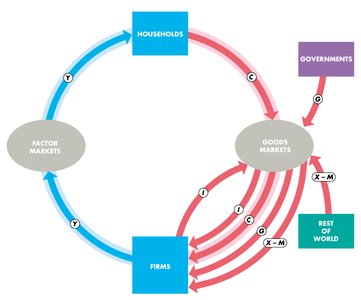
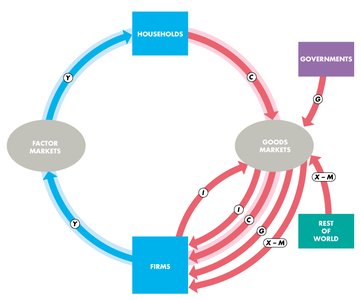
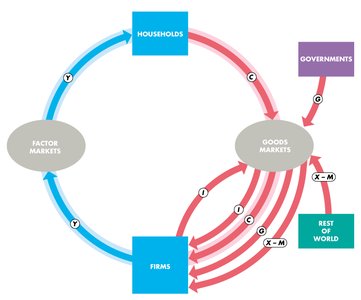
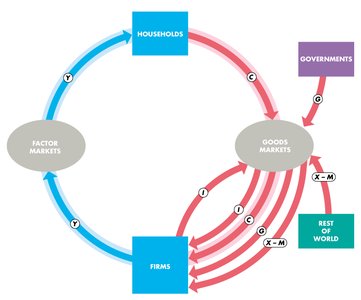
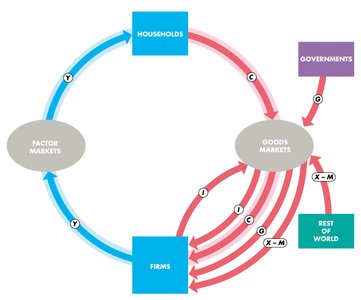
The circular flow model illustrates how payments move through the economy. It shows the flow of money between households, firms, governments, and the rest of the world, connecting goods markets and factor markets.
Expenditure: Payments for goods and services (from households, firms, government, and the rest of the world).
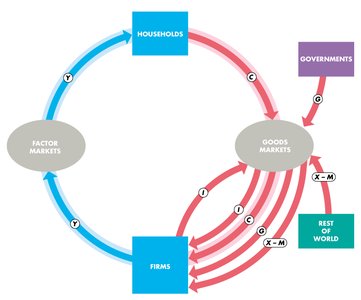
Income: Payments to households for providing factors of production (wages, interest, rent, profit).
Types of Expenditure
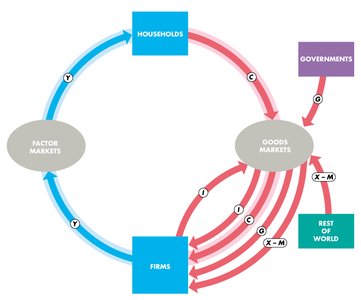
Consumption Expenditure (C): Payments from households to firms for goods and services. Largest component of GDP.
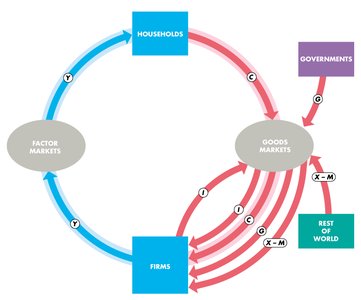
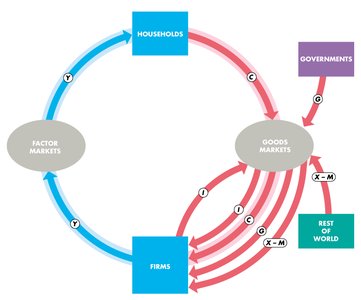
Investment (I): Payments from firms to firms for capital goods (e.g., UPS buying a new delivery van).
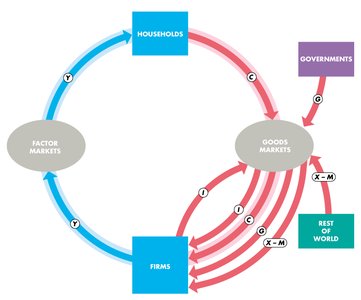
Government Expenditure (G): Payments from governments to firms for goods and services (e.g., roads, tanks, buildings). Taxes are not included.
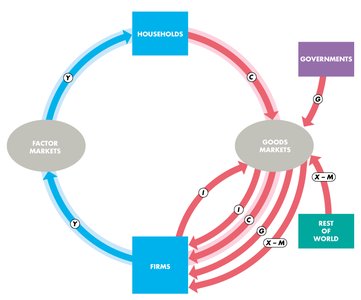
Net Exports (X - M): Payments from the rest of the world to domestic firms for exports minus payments for imports.
Consumption Expenditure Example
Households purchase goods such as cupcakes from firms.

Investment Example
Firms purchase capital goods, such as a new UPS delivery van.

Depreciation and Investment
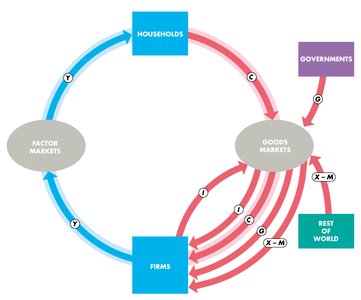
Depreciation: The decrease in the value of capital due to wear and tear or obsolescence.
Gross Investment: Total spending on new and replacement capital.
Net Investment: Increase in the value of capital (Gross Investment minus Depreciation).
Government Expenditure Example
Government purchases goods and services from firms (e.g., infrastructure projects).
Net Exports Example
Exports (X): Goods sold to the rest of the world.
Imports (M): Goods purchased from the rest of the world.
Net Exports = X - M
Income
Income flows from firms to households through factor markets. Most income is in the form of wages, but also includes interest, profits, and rent.
GDP: Aggregate Expenditure and Aggregate Income
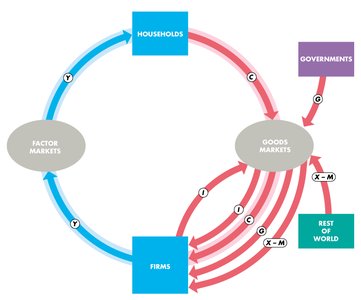
GDP can be measured in two equivalent ways:
Expenditure Approach: Sum all payments for final goods and services.
Income Approach: Sum all income earned by households from production.
GDP Formula
Aggregate Expenditure:
Aggregate Income:
GDP:
Mathematical Note
If you know all but one variable in the GDP equation, you can solve for the missing variable.
Example:
Nominal GDP and Real GDP
Comparing GDP Over Time
Nominal GDP measures the value of final goods and services at current-year prices. However, comparing nominal GDP across years can be misleading due to price changes (inflation or deflation).
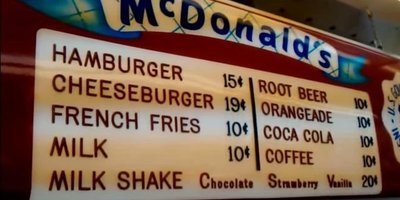
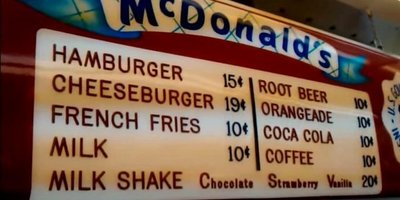
Nominal GDP: Value of production at current prices.
Real GDP: Value of production at constant (base year) prices. This allows for meaningful comparisons over time.
Calculating Real GDP
Use quantities from the year being measured, but prices from the base year.
Real GDP Per Person and Potential GDP
Real GDP per person:
Potential GDP: The highest sustainable level of GDP, given available resources.
Business Cycle: Fluctuations in real GDP around potential GDP, including expansions, peaks, recessions, and troughs.
Comparisons Across Countries
Problems with Real GDP Comparisons
Comparing real GDP across countries is complicated by differences in currencies and price levels. Exchange rates can distort comparisons, and differences in the cost of living must be considered.
Purchasing Power Parity (PPP): Adjusts for differences in price levels across countries, allowing for more accurate comparisons of living standards.
Example: A Big Mac costs less in China than in the US, so PPP-adjusted GDP gives a better sense of real purchasing power.
Limitations of Real GDP
What GDP Misses
Household Production: Goods and services produced and consumed at home are not counted in GDP.
Underground Economic Activity: Transactions not reported to the government (e.g., cash payments to avoid taxes) are excluded.
Leisure: Time spent on leisure activities is not reflected in GDP, even though it contributes to well-being.
Environmental Quality: GDP does not account for negative externalities like pollution or positive factors like clean air and water.
New Goods: GDP calculations struggle to incorporate the value of entirely new products, especially if the base year predates their existence.
Alternative Measures of Well-Being
Human Development Index (HDI)
Green Net National Product
Happiness Index
Despite its limitations, GDP remains the most widely used statistic in macroeconomics for measuring economic activity and comparing economies.
