 뒤로
뒤로Monitoring the Value of Production: GDP – Principles of Macroeconomics Study Notes
스터디 가이드 - 스마트 노트
 자료에 맞춘 맞춤형 노트, 핵심 정의, 예시, 맥락을 확장해 제공합니다.
Gross Domestic Product (GDP)
Definition and Importance
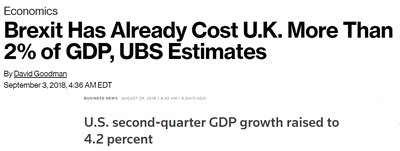
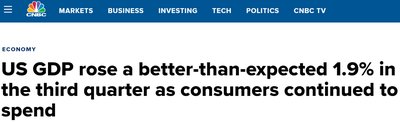
Gross Domestic Product (GDP) is the market value of all final goods and services produced within a country in a given time period. It is the most widely used measure of a country's economic productivity and overall wealth.
Market value: GDP uses the prices at which goods and services are traded in markets to aggregate diverse products into a single monetary measure.
Final goods and services: Only goods and services purchased by their final users are counted, avoiding double-counting intermediate goods.
Domestic production: Only goods and services produced within a country's borders are included.
Time period: GDP is measured over specific intervals, typically quarterly or annually.
Combining Different Goods and Services
To aggregate production of various goods (e.g., apples, oranges, cars), GDP sums their market values:
Value of apples:
Value of minivans:
Total GDP: Sum of all market values
Final vs. Intermediate Goods
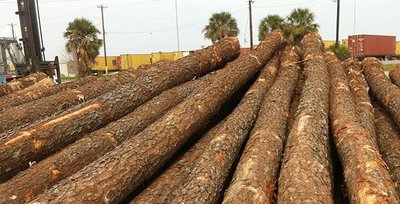
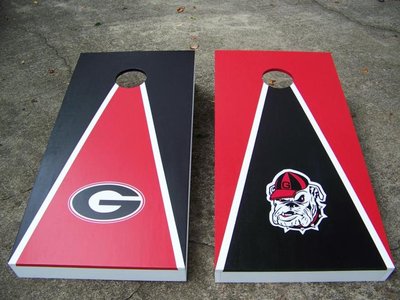
GDP includes only final goods to avoid double-counting. Intermediate goods are used as inputs in the production of final goods and are not counted separately.
Example: A log sold to a lumber company is an intermediate good; a finished cornhole board sold to a consumer is a final good.
Domestic Production
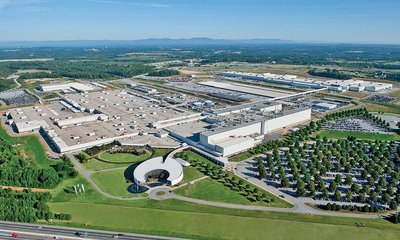
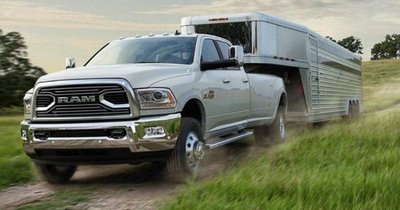
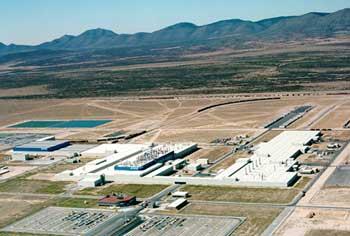
GDP measures production within a country's borders, regardless of the nationality of the producer.
Goods produced in the US count toward US GDP.
Goods produced in Mexico count toward Mexico's GDP.

Time Period
GDP is measured over a specific period, such as a quarter or a year, to track economic activity over time.
The Circular Flow of Expenditure and Income
Overview
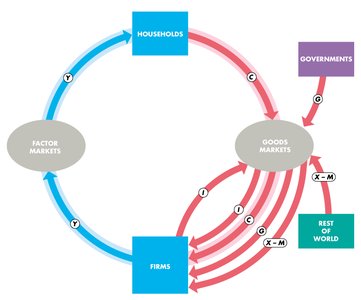
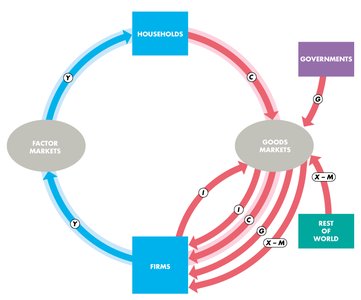
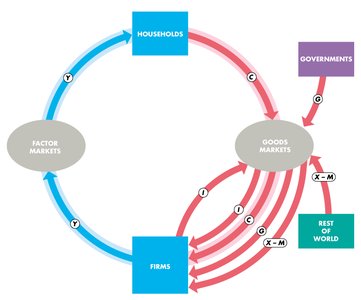
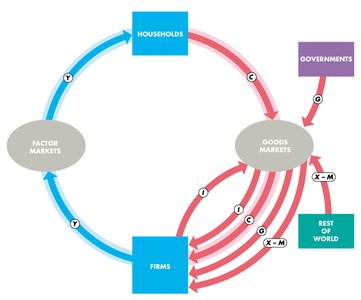
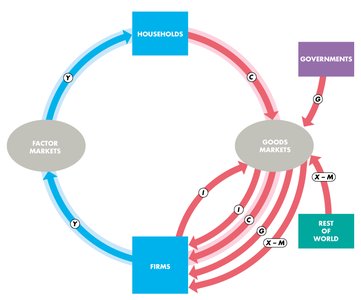
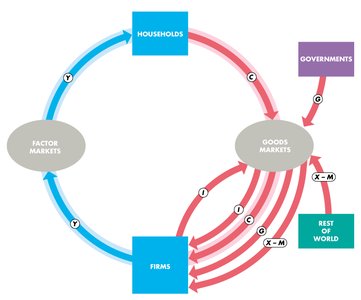
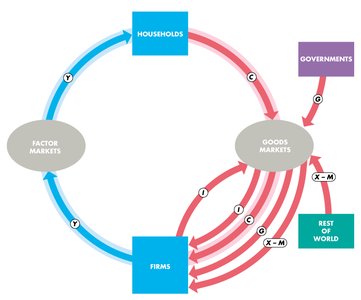
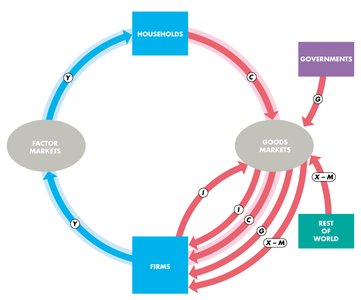
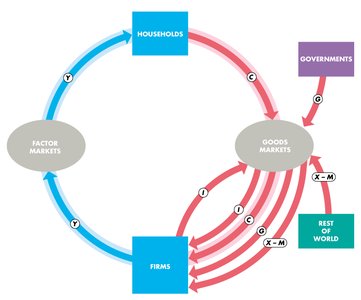
The circular flow model illustrates how money moves through the economy between households, firms, governments, and the rest of the world. Payments for goods and services flow in one direction, while income flows in the opposite direction.
Types of Expenditure
Consumption (C): Spending by households on goods and services. Largest component of GDP.
Investment (I): Spending by firms on capital goods (e.g., machinery, buildings) and inventories. Includes both new and replacement capital.
Government Expenditure (G): Spending by governments on goods and services (e.g., infrastructure, defense). Does not include transfer payments or taxes.
Net Exports (X - M): Exports minus imports. Measures the value of goods and services sold to the rest of the world minus those purchased from abroad.
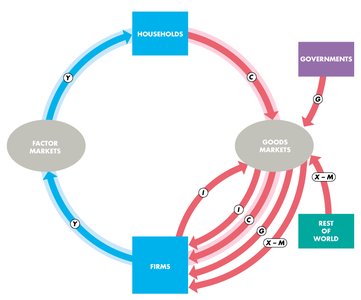
Consumption Expenditure
Payments from households to firms for goods and services.
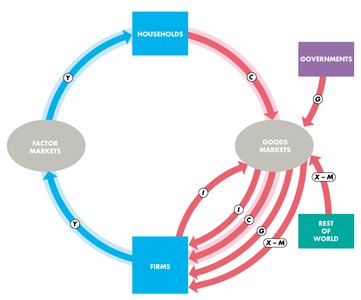

Investment
Payments from firms to other firms for capital goods. Includes gross and net investment:
Gross investment: Total spending on new and replacement capital.
Net investment: Gross investment minus depreciation (wear and tear).
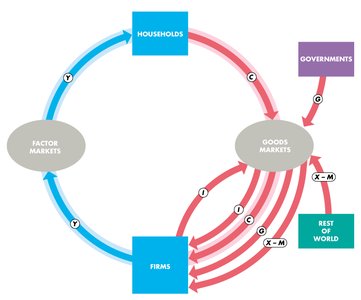

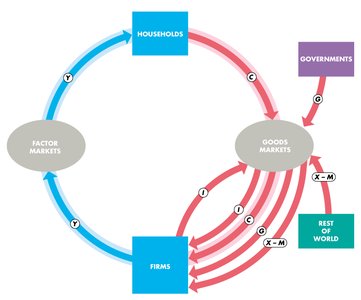
Government Expenditure
Payments from governments to firms for goods and services. Does not include taxes or transfer payments.
Net Exports
Payments from the rest of the world to domestic firms for exports, minus payments for imports.
Income
Income flows from firms to households through factor markets as wages, interest, profits, and rent. Denoted as Y.
Measuring GDP: Expenditure and Income Approaches
Expenditure Approach
Adds up all payments for final goods and services:
GDP = Aggregate Expenditure = C + I + G + X - M
Income Approach
Adds up all income earned by households from producing goods and services:
GDP = Aggregate Income = Y
Key Equation
The two approaches yield the same result:
Solving for Missing Variables
If all but one variable is known, the GDP equation can be rearranged to solve for the missing value. For example:
Nominal GDP and Real GDP
Nominal GDP
Nominal GDP is the value of final goods and services produced in a given year, measured at current year prices. It does not account for changes in price level (inflation or deflation).
Real GDP
Real GDP measures the value of final goods and services produced in a given year using the prices from a reference base year. This allows for meaningful comparisons over time by removing the effects of price changes.
Use quantities from the year being measured, but prices from the base year.
Real GDP per Person
Real GDP per person (per capita) is calculated as:
This is a common measure of the average standard of living.
Potential GDP and the Business Cycle
Potential GDP
Potential GDP is the highest level of GDP that can be sustained over the long run, given available resources and technology. It grows steadily over time.
Business Cycle
Real GDP fluctuates around potential GDP, following the business cycle:
Expansion: Real GDP increases.
Peak: Temporary high point of real GDP.
Recession: Real GDP decreases.
Trough: Temporary low point of real GDP.
The timing of peaks and troughs is irregular and unpredictable.
Comparing GDP Across Countries
Currency Conversion
To compare GDP between countries, values must be converted to a common currency using exchange rates. However, this can be misleading due to differences in price levels.
Purchasing Power Parity (PPP)
GDP measured at purchasing power parity (PPP) adjusts for differences in price levels across countries, providing a more accurate comparison of living standards.
PPP compares how much a typical basket of goods costs in each country, using a common set of prices.
Limitations of Real GDP
Household Production
Productive activities that do not involve market transactions (e.g., home-cooked meals, childcare by parents) are not counted in GDP, leading to underestimation of total production.
Underground Economic Activity
Goods and services paid for but not reported to the government (e.g., cash jobs to avoid taxes) are not included in GDP.
Leisure
Time spent on leisure activities is valuable but not included in GDP. Countries with more leisure may have lower GDP but higher well-being.
Environmental Quality
GDP does not account for environmental quality. Two countries with the same GDP may differ greatly in quality of life due to differences in air and water quality.
New Goods and Technological Change
GDP calculations based on base year prices cannot account for entirely new goods (e.g., smartphones) that did not exist in the base year, limiting the accuracy of comparisons over time.
Alternative Measures of Well-Being
Other indicators, such as the Human Development Index, Green Net National Product, and Happiness Index, have been proposed to address GDP's limitations. Despite these, GDP remains the most-used statistic in macroeconomics.
