 뒤로
Microbial Evolution and Systematics: Origins, Diversification, and Phylogeny
스터디 가이드 - 스마트 노트
 자료에 맞춘 맞춤형 노트, 핵심 정의, 예시, 맥락을 확장해 제공합니다.
Microbial Evolution and Systematics
Origins of Life
The study of microbial evolution begins with understanding the earliest evidence and conditions for life on Earth. Geological and fossil records provide insight into the timeline and nature of ancient microbial communities.
Early Geological Evidence: Life is believed to have originated approximately 3.4–4 billion years ago, soon after the formation of Earth (~4.5 billion years ago).
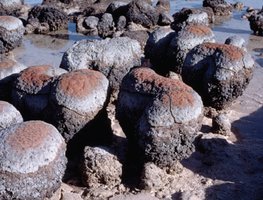
Stromatolites: Layered structures formed by microbial mats, primarily cyanobacteria, are among the oldest evidence of life. These structures are found in ancient rocks and modern environments.
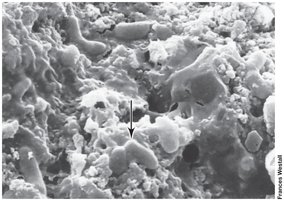
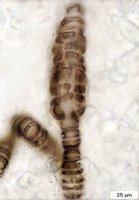
Microfossils: Fossilized remains of ancient microorganisms, such as rod-shaped bacteria, are observed in rocks dating back 3.45 billion years.
Evidence of Life
Multiple lines of evidence support the existence of early microbial life, including stromatolites, isotope ratios, and microfossils.
Isotope Ratios: Ancient limestones depleted in 13CO2 suggest biological activity.
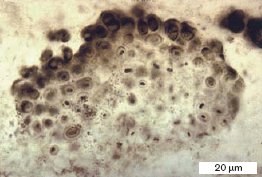
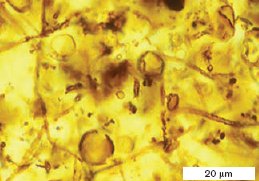
Microfossils: Microscopic structures resembling modern cyanobacteria, filamentous prokaryotes, and algae are found in ancient rocks.
Origin of Cellular Life
Cellular life likely evolved under hostile, anoxic, and high-temperature conditions. The formation of organic precursors and biological compartments was critical for the emergence of cells.
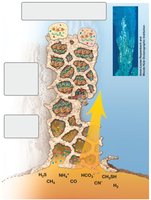
Mineral Compartments: Early cells may have originated in mineral pores, which allowed coupling of energetic reactions to molecular replication.
Lipid Bilayers: Eventually, lipid bilayers replaced mineral compartments, enabling cells to disperse and colonize new habitats.
Subsurface Origin Hypothesis
This hypothesis proposes that life originated at hydrothermal springs on the ocean floor, where conditions were less hostile and energy sources were abundant.
Hydrothermal Springs: Provided reduced inorganic compounds (e.g., H2, H2S) and stable environments for the formation of critical molecules and compartmentalized structures.
Models for Early Life
Several models explain the origin of life, including the prebiotic soup and self-replicating systems.
Prebiotic Soup: Small organic molecules formed abiotically, possibly through lightning or volcanic activity, and could replicate in laboratory conditions.

Lipid Micelles: Lipids spontaneously organize into micelles, forming primitive cell-like structures.
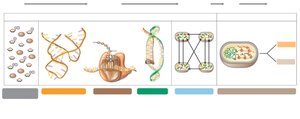
RNA World Theory: The first self-replicating systems may have been RNA-based. RNA can bind small molecules, has catalytic activity, and may have catalyzed its own synthesis.
Transition to DNA and Proteins: Proteins eventually took over most catalytic functions, and DNA became the primary genetic repository.
Earliest Molecules - RNA
RNA is believed to have been the original molecule fulfilling both protein and hereditary functions. Ribozymes are RNA molecules capable of catalyzing peptide bond formation and replication.
Liposomes: Early cells may have consisted of RNA surrounded by liposomes, providing compartmentalization.
Metabolic Diversification
After the origin of cells, microbial life diversified to exploit various resources. Early metabolism was anaerobic, with chemolithotrophs using H2 as electron donor and S0 as electron acceptor.
Autotrophs: CO2 was likely the major source of carbon.
Chemoorganotrophs: Evolution of bacteria capable of using organic compounds as energy sources occurred as these compounds accumulated.
Photosynthesis and the Oxidation of Earth
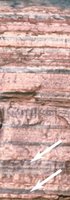
Anoxygenic phototrophs evolved around 3.5 billion years ago, using H2S as electron donor. Cyanobacteria later developed the ability to use H2O, generating O2 and initiating the Great Oxidation Event.
Great Oxidation Event: By 2.4 billion years ago, O2 concentrations increased, transforming Earth's environment and enabling new metabolic schemes.
Oxidation of Earth
The rise of O2 restricted anaerobic bacteria and archaea to anoxic habitats, while oxic environments allowed for the evolution of aerobic respiration and greater diversity.
Ozone Shield: UV radiation converted O2 to O3, forming an ozone layer that protected life from harmful radiation.
The Species Concept in Microbiology
There is no universally accepted species concept for prokaryotes. The phylogenetic species concept, based on genetic cohesion and common ancestry, is the best alternative.
Criteria: 70% or greater DNA–DNA hybridization and 97% or greater 16S rRNA gene sequence identity are used to define species.
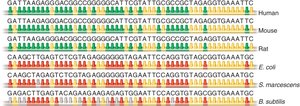
Phylogenetic Analysis: Evolutionary relationships are determined by comparing nucleotide sequences, especially conserved genes like small subunit rRNA.
Molecular Clocks
Molecular clocks assume that neutral mutations accumulate at a constant rate, allowing estimation of evolutionary divergence based on sequence differences.
Conserved Sequences: Genes for small subunit rRNA are ideal for phylogenetic analysis due to their universality and slow rate of change.
Phylogenetic Analysis Using 16S rRNA
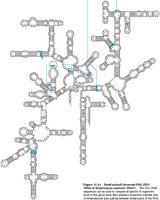
Small subunit rRNA genes are used to compare evolutionary distances between organisms. Sequence differences are proportional to the time since divergence.
16S rRNA Comparison: Allows construction of phylogenetic trees and identification of evolutionary relationships.
Phylogenetic Distance Mapping
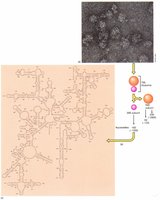
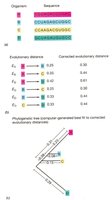
Phylogenetic distance maps visualize evolutionary distances as non-identical nucleotides, corrected for back mutations. Computer analysis generates best-fit trees.
Microbial Phylogeny: The Three Domains
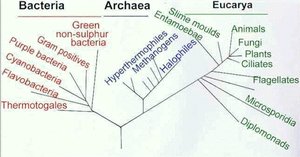
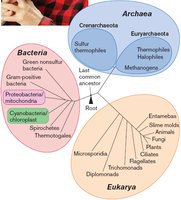
Microbial phylogeny is organized into three domains: Archaea, Bacteria, and Eukaryotes. The root of the tree is unresolved due to lack of a clear outgroup.
Horizontal Gene Transfer (HGT)
HGT is the acquisition of DNA from another cell, more frequent in microbes than in multicellular organisms. It complicates phylogenetic analysis and contributes to genetic diversity.
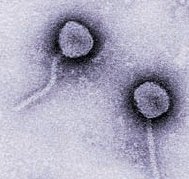
Mechanisms: Plasmid transfer, transposable elements, and bacteriophage-mediated transduction.
Gene Types: "Informational" genes are rarely transferred, while "operational" genes are often transferred and confer selective advantages.
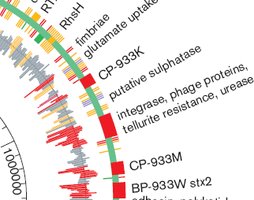
Pathogenicity Islands
Pathogenicity islands are large sets of genes transferred as a unit, conferring the ability to invade eukaryotic hosts. Example: E. coli O157:H7 contains several gene groups not found in other E. coli strains.
Identifying Strains: Multilocus Sequence Typing (MLST)
MLST is used to distinguish between closely related strains by sequencing several housekeeping genes. It is widely used in clinical microbiology and epidemiology.
Process: DNA is isolated, target genes are amplified and sequenced, alleles are analyzed, and strains are compared to generate phylogenetic trees.

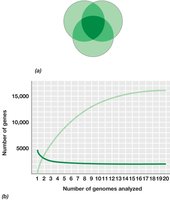
Microbial Genomes: Core and Pan Genome
Microbial genomes are dynamic, with dramatic differences in size and gene content between strains. Genes are classified as core (shared by all members) or pan (core plus non-shared genes).
Genome Analysis: Example: E. coli strains have an average of 4721 genes, with a core genome of 1976 genes and a pan genome of 17,838 genes.
Deletions: Frequent deletions can reduce genome size, providing selective advantages.
Symbiosis and Coevolution
Microbes interact with other organisms through mutualism and parasitism, leading to coevolution. Parasites often lose functions provided by their hosts.
Endosymbionts
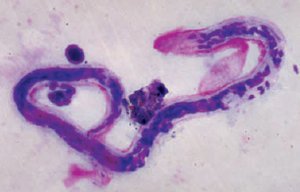
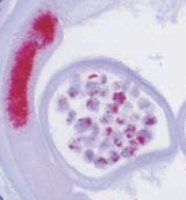
Many organisms live inside others, such as intestinal flora or intracellular symbionts. Paramecium and Chlorella exemplify mutualistic endosymbiosis, where algae provide nutrients and Paramecium offers protection.
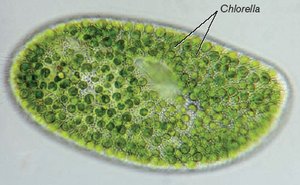
Endosymbiotic Origin of Eukaryotes
The endosymbiotic hypothesis states that mitochondria and chloroplasts arose from symbiotic associations of prokaryotes within another cell. Mitochondria originated from respiring bacteria, and chloroplasts from cyanobacteria-like organisms.
Evidence: Both organelles contain circular genomes, prokaryotic-sized ribosomes (70S), and 16S rRNA characteristic of Bacteria.
Origin of Eukaryotes
Eukaryotes began as a nucleus-bearing lineage that later acquired mitochondria and chloroplasts by endosymbiosis. The exact origin remains unresolved, but it involved the engulfment of a H2-producing bacterium by a H2-consuming archaeon.
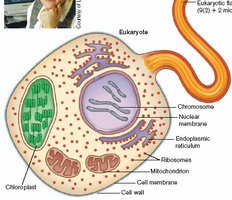
Mitochondria and Chloroplasts
Mitochondria and chloroplasts behave like endosymbiotic organisms, possessing their own circular genomes, double membranes, and electron transport components. They reproduce independently and have lost some functions to their host cells.
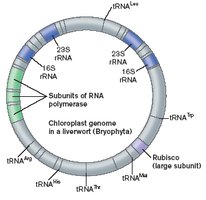
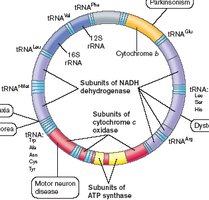
Genetic Exchange in Bacteria
Plasmids and other DNA can be transferred by conjugation, transformation, or transduction to other bacterial species, contributing to genetic diversity and adaptation.
Summary Table: Core vs. Pan Genome
Genome Type | Description | Example (E. coli) |
|---|---|---|
Core Genome | Genes shared by all members of a species | 1976 genes |
Pan Genome | Core genome plus genes not shared by all members | 17,838 genes |
Summary Table: Species Identification Criteria
Criterion | Threshold |
|---|---|
DNA–DNA Hybridization | ≥ 70% |
16S rRNA Gene Sequence Identity | ≥ 97% |
