 뒤로
뒤로Chapter 1: Introduction to Microeconomics – Key Concepts and Graphical Analysis
스터디 가이드 - 스마트 노트
 자료에 맞춘 맞춤형 노트, 핵심 정의, 예시, 맥락을 확장해 제공합니다.
What is Economics?
Definition of Economics
Economics is the study of how individuals and societies allocate scarce resources to satisfy unlimited wants. The fundamental problem in economics is scarcity, which means our resources are limited, so we must make choices about how to use them.
Scarcity: Our inability to satisfy all our wants due to limited resources.
Choices: Because of scarcity, we must decide what to produce, how to produce, and for whom to produce.
Microeconomics vs. Macroeconomics
Microeconomics focuses on the choices made by individuals and businesses, and how these choices interact in markets. Macroeconomics deals with the economy as a whole, including issues like inflation, unemployment, and economic growth.
Microeconomic topics: Consumer behavior, pricing, market structures.
Macroeconomic topics: National income, inflation, unemployment.
Example: "Why does a consumer buy less honey?" is a microeconomic question.
Two Big Economic Questions
Key Questions
Economics seeks to answer two fundamental questions:
What, how, and for whom are goods and services produced?
When do choices made in self-interest also promote the social interest?
Factors of Production
The resources used to produce goods and services are called factors of production:
Land: Earns rent.
Labor: Earns wages.
Capital: Earns interest.
Entrepreneurship: Earns profit.
The Economic Way of Thinking
Opportunity Cost
The opportunity cost of an action is the value of the next best alternative forgone. It is a central concept in economics, guiding rational decision-making.
Example: If you choose to attend university, your opportunity cost includes the income you could have earned and other activities you forego.
Formula:
Marginal Analysis
Economists analyze decisions at the margin, considering the additional benefit (marginal benefit) and additional cost (marginal cost) of a small change in activity.
Rational Choice: If marginal benefit exceeds marginal cost, increase the activity.
Formula:
Positive and Normative Statements
Types of Economic Statements
Economists distinguish between positive statements (describing what is) and normative statements (prescribing what ought to be).
Positive Statement: "If the price of gasoline rises, people will drive less."
Normative Statement: "Greece is the best place to vacation."
Graphing Data in Economics
Graphs Used in Economic Models
Graphs are essential tools in economics for visualizing relationships between variables. Common patterns include:
Variables moving in the same direction (positive correlation).
Variables moving in opposite directions (negative correlation).
Variables with a maximum or minimum.
Variables that are unrelated.
The Slope of a Relationship
The slope of a line measures how one variable changes in relation to another. For a straight line, the slope is constant and calculated as "rise over run." For a curve, the slope at a point is the slope of the tangent line at that point.
Formula for Slope:
Example: If the slope is -2 at point A, it means y decreases by 2 units for every 1 unit increase in x.
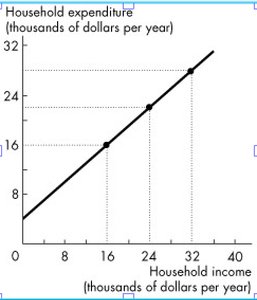
Graphical Example: Household Expenditure vs. Income
The graph below shows the relationship between household income and household expenditure. The slope of the line can be calculated as follows:
Calculation:
Equation: (where y is expenditure and x is income)
Summary Table: Factors of Production and Earnings
Factor of Production | Earnings |
|---|---|
Land | Rent |
Labor | Wages |
Capital | Interest |
Entrepreneurship | Profit |
Additional info:
These notes are based on Pearson materials for Parkin & Bade, Microeconomics, 11e, and are suitable for introductory microeconomics courses.
Graphical analysis is fundamental for understanding economic relationships and making informed decisions.
