 뒤로
뒤로Demand and Supply: Foundations of Market Equilibrium
스터디 가이드 - 스마트 노트
 자료에 맞춘 맞춤형 노트, 핵심 정의, 예시, 맥락을 확장해 제공합니다.
Demand and Supply
Competitive Markets and Price as Opportunity Cost
A competitive market is one in which many buyers and sellers interact, and no single participant can influence the market price. In such markets, the price of a good represents its opportunity cost, reflecting the value of the next best alternative foregone.
The Law of Demand
The law of demand states that, other things remaining the same, the higher the price of a good, the lower the quantity demanded; conversely, the lower the price, the higher the quantity demanded. This relationship is typically represented as:
Key Point 1: Demand decreases as price increases.
Key Point 2: Demand increases as price decreases.
The demand equation can be written as:
where is quantity demanded, is price, and , are constants.
Substitution and Income Effects
Substitution Effect: When the price of a good rises, consumers seek substitutes, decreasing the quantity demanded.
Income Effect: A price increase reduces consumers' purchasing power, decreasing the quantity demanded.
The Demand Curve
The demand curve is a graphical representation of the relationship between price and quantity demanded, typically downward sloping.
Individual Demand Curve: Shows the quantity demanded by one consumer at various prices.
Market Demand Curve: Aggregates individual demand curves for all consumers in the market.
Example: If the price of energy bars increases from $1.00 to $1.50, the quantity demanded decreases from 16 to 10 million bars per week.
A Change in Demand
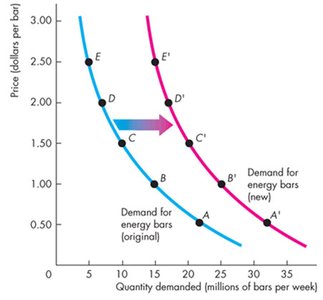
A change in demand occurs when factors other than price affect buying plans, shifting the demand curve. Six main factors are:
Prices of related goods (substitutes and complements)
Expected future prices
Income
Expected future income and credit
Population
Preferences
When demand increases, the curve shifts right; when it decreases, it shifts left.
Normal and Inferior Goods
Normal Good: Demand increases as income increases.
Inferior Good: Demand decreases as income increases.
The Law of Supply
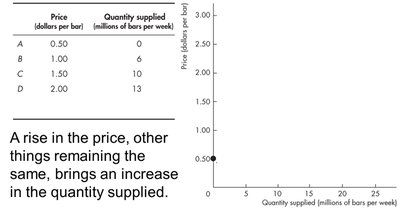
The law of supply states that, other things remaining the same, the higher the price of a good, the greater the quantity supplied; the lower the price, the smaller the quantity supplied. The supply equation can be written as:
where is quantity supplied, is price, and , are constants.
Key Point 1: Supply increases as price increases.
Key Point 2: Supply decreases as price decreases.
Example: As the price of energy bars rises from $0.50 to $2.00, the quantity supplied increases from 0 to 13 million bars per week.
Factors Affecting Supply
Six main factors that change supply:
Prices of factors of production
Prices of related goods produced
Expected future prices
Number of suppliers
Technology
State of nature
Market Equilibrium
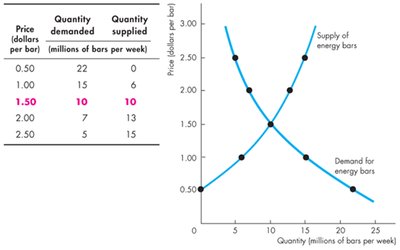
Market equilibrium occurs when the plans of buyers and sellers balance, resulting in an equilibrium price and quantity. At this point, the quantity demanded equals the quantity supplied.
Equilibrium Price: The price at which quantity demanded equals quantity supplied.
Equilibrium Quantity: The quantity bought and sold at the equilibrium price.
Shortage and Surplus
Shortage: Occurs when quantity demanded exceeds quantity supplied at a given price, causing upward pressure on price.
Surplus: Occurs when quantity supplied exceeds quantity demanded at a given price, causing downward pressure on price.
Example: At $2, there is a shortage; at $7, there is a surplus; at $4, the market is in equilibrium.
Price (dollars per unit) | Quantity Demanded (units) | Quantity Supplied (units) |
|---|---|---|
1 | 1,100 | 50 |
2 | 800 | 200 |
3 | 600 | 420 |
4 | 500 | 500 |
5 | 420 | 580 |
6 | 350 | 640 |
7 | 320 | 680 |
8 | 300 | 700 |
Predicting Changes in Price and Quantity
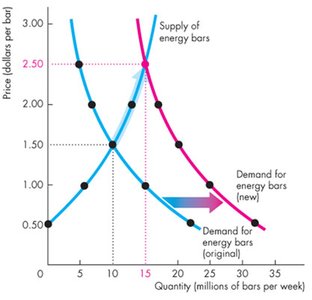
Changes in demand or supply shift the respective curves, affecting equilibrium price and quantity:
Increase in Demand: Raises equilibrium price and quantity.
Increase in Supply: Lowers equilibrium price, raises equilibrium quantity.
Decrease in Supply: Raises equilibrium price, lowers equilibrium quantity.
Simultaneous Increase in Demand and Decrease in Supply: Price increases; quantity change depends on relative shifts.
Graphical Analysis of Shifts
When demand increases, the demand curve shifts right. When supply increases, the supply curve shifts right. These shifts can be visualized on the demand and supply graph.
Application: Solving for Equilibrium
Given demand and supply equations:
Demand:
Supply:
Set and solve for equilibrium:
Equilibrium price is $45, equilibrium quantity is 5.
Key Concepts Summary
Law of demand and supply
Demand and supply curves
Individual and market curves
Movements vs. shifts
Factors affecting demand and supply
Shortage, surplus, and equilibrium
Normal and inferior goods
