 뒤로
Demand and Supply: Foundations of Market Equilibrium in Microeconomics
스터디 가이드 - 스마트 노트
 자료에 맞춘 맞춤형 노트, 핵심 정의, 예시, 맥락을 확장해 제공합니다.
Demand and Supply
Markets and Prices
Markets are fundamental to microeconomics, serving as the arena where buyers and sellers interact. A competitive market is characterized by many buyers and sellers, ensuring that no single participant can influence the price. The money price is the monetary amount required to purchase a good, while the relative price is the ratio of the money price of one good to another, representing its opportunity cost.
Demand
Demand reflects consumers' plans to purchase goods and services, based on their wants, ability to pay, and definite intention to buy. The quantity demanded is the amount consumers plan to buy at a specific price over a given period.
The Law of Demand
The law of demand states that, ceteris paribus, as the price of a good increases, the quantity demanded decreases, and vice versa. This relationship is explained by:
Substitution Effect: When the price of a good rises, consumers seek alternatives, reducing quantity demanded.
Income Effect: A price increase reduces consumers' purchasing power, decreasing quantity demanded.
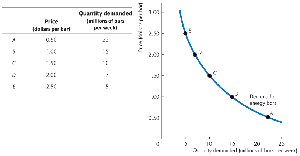
Demand Curve and Demand Schedule
The demand curve illustrates the relationship between price and quantity demanded, holding other factors constant. It is also a willingness-and-ability-to-pay curve, representing the marginal benefit of consumption.
A Change in Demand
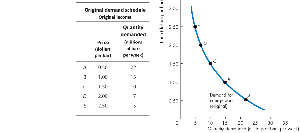
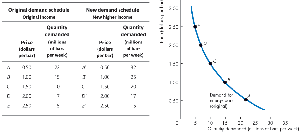
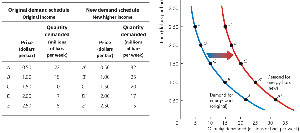
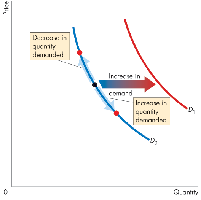
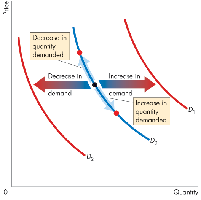
A change in demand occurs when factors other than price alter consumers' buying plans, shifting the demand curve. The main determinants are:
Prices of related goods: Substitutes and complements affect demand.
Expected future prices: Anticipation of price changes influences current demand.
Income: Higher income increases demand for normal goods, decreases for inferior goods.
Expected future income and credit: Expectations and credit availability can boost current demand.
Population: Larger populations increase demand.
Preferences: Individual tastes shape demand.
Change in Quantity Demanded vs. Change in Demand
A movement along the demand curve is caused by a change in price, while a shift of the demand curve results from changes in other determinants.
Supply
Supply represents producers' plans to sell goods and services, based on their resources, technology, profitability, and intention to produce. The quantity supplied is the amount producers plan to sell at a specific price over a given period.
The Law of Supply
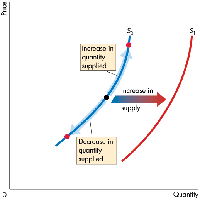
The law of supply states that, ceteris paribus, as the price of a good increases, the quantity supplied increases, and vice versa. This is due to rising marginal costs as production expands.
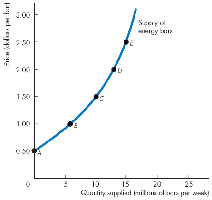
Supply Curve and Supply Schedule
The supply curve shows the relationship between price and quantity supplied, holding other factors constant. It is also a minimum-supply-price curve, reflecting the marginal cost of production.
A Change in Supply
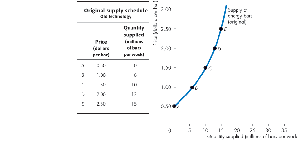
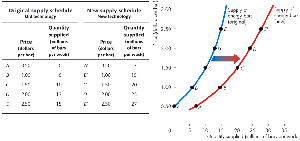
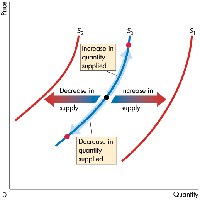
A change in supply occurs when factors other than price alter producers' selling plans, shifting the supply curve. The main determinants are:
Prices of factors of production: Higher input prices decrease supply.
Prices of related goods produced: Substitutes and complements in production affect supply.
Expected future prices: Anticipation of price changes influences current supply.
Number of suppliers: More suppliers increase supply.
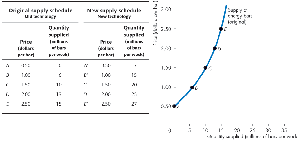
Technology: Technological advances increase supply.
State of nature: Natural events can affect supply.
Change in Quantity Supplied vs. Change in Supply
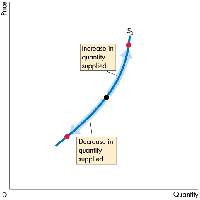
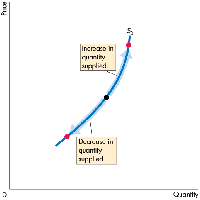
A movement along the supply curve is caused by a change in price, while a shift of the supply curve results from changes in other determinants.
Market Equilibrium
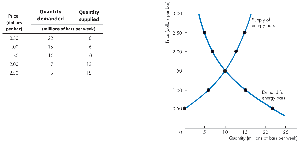
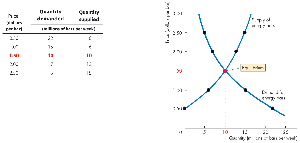
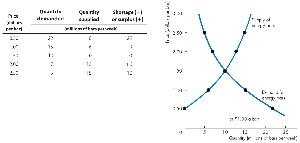
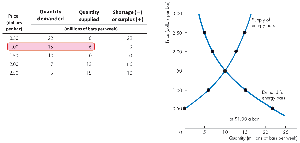
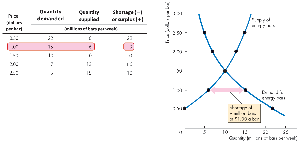
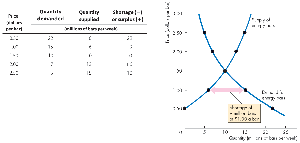
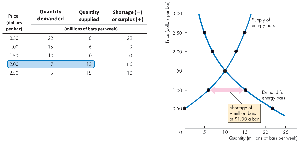
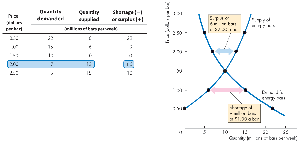
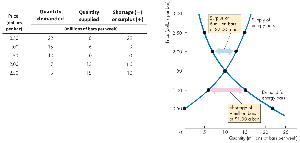
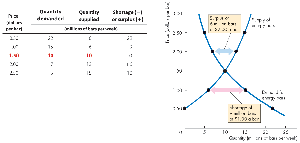
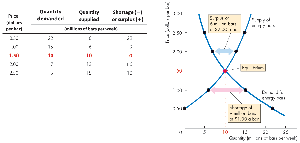
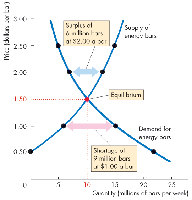
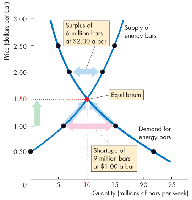
Market equilibrium occurs when the price balances the plans of buyers and sellers, resulting in the equilibrium price and equilibrium quantity. Price acts as a regulator, adjusting to eliminate shortages and surpluses.
Predicting Changes in Price and Quantity
An Increase in Demand
When demand increases, the demand curve shifts rightward, creating a shortage at the original price. Price rises, and quantity supplied increases along the supply curve.
A Decrease in Demand
When demand decreases, the demand curve shifts leftward, creating a surplus at the original price. Price falls, and quantity supplied decreases along the supply curve.
An Increase in Supply
When supply increases, the supply curve shifts rightward, creating a surplus at the original price. Price falls, and quantity demanded increases along the demand curve.
A Decrease in Supply
When supply decreases, the supply curve shifts leftward, creating a shortage at the original price. Price rises, and quantity demanded decreases along the demand curve.
Changes in Both Demand and Supply
Simultaneous changes in demand and supply affect equilibrium price and quantity in complex ways:
Same direction: Both increase or decrease, equilibrium quantity changes, price effect is uncertain.
Opposite direction: One increases, the other decreases, equilibrium price changes, quantity effect is uncertain.
Key Equations
Relative Price:
Demand Function: where = quantity demanded, = price, = price of substitutes, = price of complements, = income, = expectations, = population, = preferences.
Supply Function: where = quantity supplied, = price, = price of inputs, = price of related goods, = expectations, = number of suppliers, = technology, = state of nature.
Equilibrium Condition:
Summary Table: Factors Affecting Demand and Supply
Factor | Effect on Demand | Effect on Supply |
|---|---|---|
Price of Good | Movement along curve | Movement along curve |
Prices of Related Goods | Substitutes/complements | Substitutes/complements in production |
Income | Normal/inferior goods | --- |
Expected Future Prices | Increase/decrease demand | Decrease/increase supply |
Population | Increase demand | --- |
Preferences | Change demand | --- |
Number of Suppliers | --- | Increase supply |
Technology | --- | Increase supply |
State of Nature | --- | Increase/decrease supply |
Example: If the price of energy bars rises, quantity demanded falls (movement along demand curve), and quantity supplied rises (movement along supply curve). If income rises, demand for energy bars (a normal good) increases, shifting the demand curve rightward.
Additional info: These notes expand on the original slides by providing definitions, equations, and a summary table for academic completeness.
