 뒤로
Demand, Supply, and Market Equilibrium: Microeconomics Study Notes
스터디 가이드 - 스마트 노트
 자료에 맞춘 맞춤형 노트, 핵심 정의, 예시, 맥락을 확장해 제공합니다.
Demand, Supply, and Market Equilibrium
Introduction to Markets and Prices
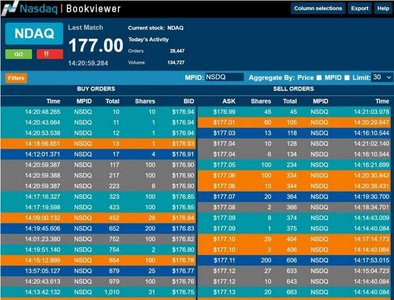
Markets are fundamental to microeconomics, serving as the setting where buyers and sellers interact to exchange goods and services. Understanding how prices are determined and how markets function is essential for analyzing economic outcomes.
Market: Any arrangement that enables buyers and sellers to get information and do business with each other.
Competitive Market: A market with many buyers and sellers, so no single participant can influence the price.
Money Price: The amount of money needed to buy a good.
Relative Price: The ratio of the money price of one good to the money price of the next best alternative; represents the opportunity cost.

Demand
Definition and Law of Demand
Demand reflects consumers' willingness and ability to purchase goods and services at various prices. The law of demand describes the inverse relationship between price and quantity demanded.
Demand: The entire relationship between the price of a good and the quantity demanded.
Quantity Demanded: The amount consumers plan to buy during a particular period at a particular price.
Law of Demand: Other things remaining the same, as the price of a good rises, the quantity demanded decreases; as the price falls, the quantity demanded increases.
Substitution Effect: When the price of a good rises, people switch to substitutes, decreasing quantity demanded.
Income Effect: A higher price reduces consumers' purchasing power, decreasing quantity demanded.
Demand Curve and Demand Schedule
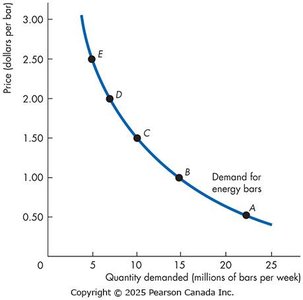
The demand curve graphically represents the relationship between price and quantity demanded, holding other factors constant. The demand schedule is a table showing this relationship.
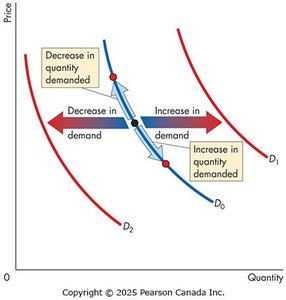
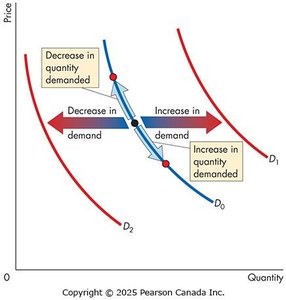
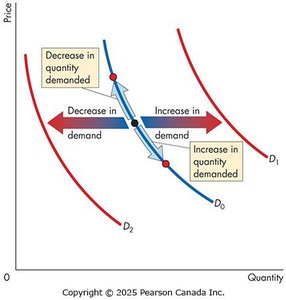
A movement along the demand curve is caused by a change in the price of the good.
A shift of the demand curve is caused by changes in other factors (not the price of the good itself).
Willingness and Ability to Pay
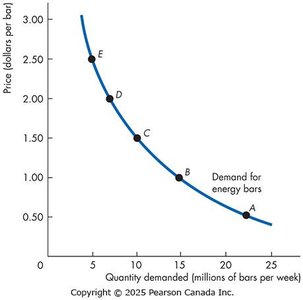
The demand curve can also be interpreted as a willingness-and-ability-to-pay curve, where each point shows the maximum price a consumer is willing to pay for an additional unit, reflecting marginal benefit.
Changes in Demand
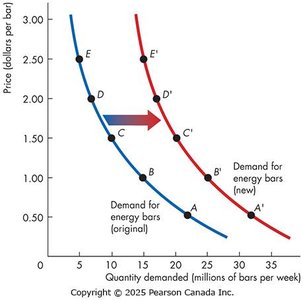
Demand changes when factors other than the good's price change. This results in a new demand curve.
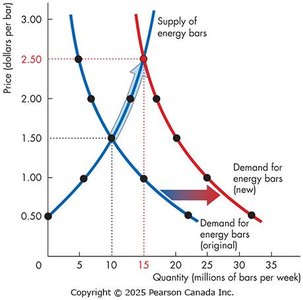
Increase in Demand: Demand curve shifts rightward.
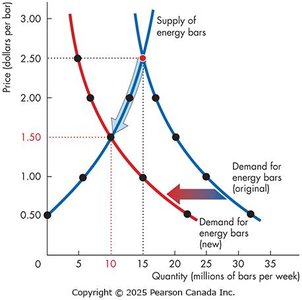
Decrease in Demand: Demand curve shifts leftward.
Factors that Change Demand:
Prices of related goods (substitutes and complements)
Expected future prices
Income (normal and inferior goods)
Expected future income and credit
Population
Preferences
Change in Quantity Demanded vs. Change in Demand
A change in the price of the good causes a movement along the demand curve (change in quantity demanded). A change in any other factor causes the demand curve to shift (change in demand).
Supply
Definition and Law of Supply
Supply represents the relationship between the price of a good and the quantity producers are willing to sell. The law of supply states that higher prices incentivize greater production.
Supply: The entire relationship between the quantity supplied and the price of a good.
Quantity Supplied: The amount producers plan to sell during a given period at a particular price.
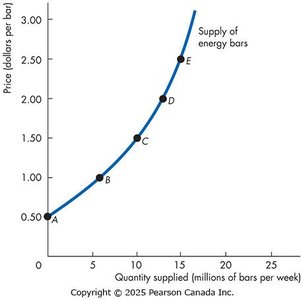
Law of Supply: Other things remaining the same, as the price of a good rises, the quantity supplied increases; as the price falls, the quantity supplied decreases.
Marginal cost typically increases as quantity produced increases, so higher prices are needed to cover these costs.
Supply Curve and Supply Schedule
The supply curve shows the relationship between price and quantity supplied, holding other factors constant. The supply schedule is a table showing this relationship.
Minimum Supply Price and Marginal Cost
The supply curve can also be interpreted as a minimum-supply-price curve, showing the lowest price at which a producer is willing to sell an additional unit, which equals the marginal cost.
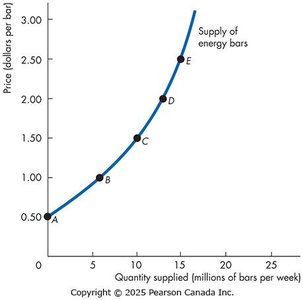
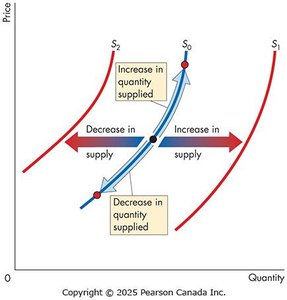
Changes in Supply
Supply changes when factors other than the good's price change, resulting in a new supply curve.
Increase in Supply: Supply curve shifts rightward.
Decrease in Supply: Supply curve shifts leftward.
Factors that Change Supply:
Prices of factors of production
Prices of related goods produced (substitutes and complements in production)
Expected future prices
Number of suppliers
Technology
State of nature (e.g., weather, natural disasters)
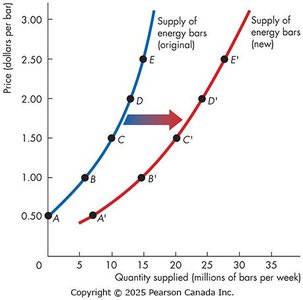
Change in Quantity Supplied vs. Change in Supply
A change in the price of the good causes a movement along the supply curve (change in quantity supplied). A change in any other factor causes the supply curve to shift (change in supply).
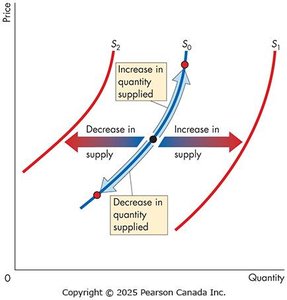
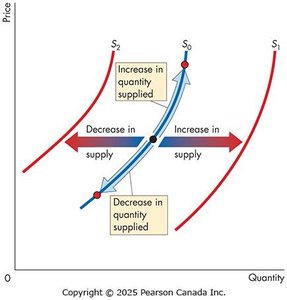
Market Equilibrium
Equilibrium Price and Quantity
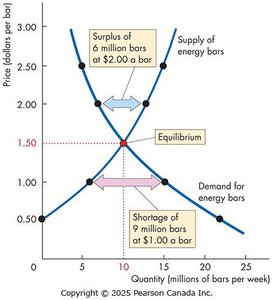
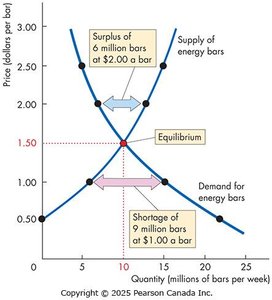
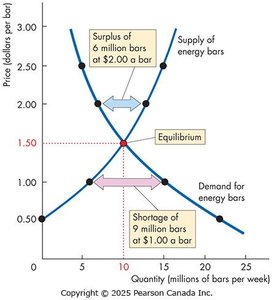
Market equilibrium occurs when the quantity demanded equals the quantity supplied at a particular price. This price is called the equilibrium price, and the corresponding quantity is the equilibrium quantity.
At prices above equilibrium, a surplus exists, causing price to fall.
At prices below equilibrium, a shortage exists, causing price to rise.
At equilibrium, there is no tendency for price to change unless demand or supply changes.
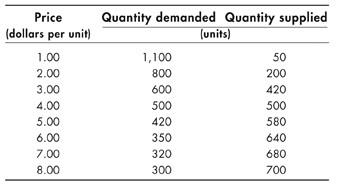
Market Equilibrium Table
The following table summarizes the relationship between price, quantity demanded, and quantity supplied, illustrating how shortages and surpluses arise at different prices.
Price (dollars per unit) | Quantity demanded (units) | Quantity supplied (units) |
|---|---|---|
1.00 | 1,100 | 50 |
2.00 | 800 | 200 |
3.00 | 600 | 420 |
4.00 | 500 | 500 |
5.00 | 420 | 580 |
6.00 | 350 | 640 |
7.00 | 320 | 680 |
8.00 | 300 | 700 |
Predicting Changes in Price and Quantity
Effects of Changes in Demand and Supply
Shifts in demand and/or supply curves lead to changes in equilibrium price and quantity. The direction of these changes depends on which curve shifts and in which direction.
Increase in Demand: Raises both equilibrium price and quantity.
Decrease in Demand: Lowers both equilibrium price and quantity.
Increase in Supply: Lowers equilibrium price, raises equilibrium quantity.
Decrease in Supply: Raises equilibrium price, lowers equilibrium quantity.
Simultaneous Changes: When both demand and supply change, the effect on equilibrium price or quantity may be indeterminate without more information.
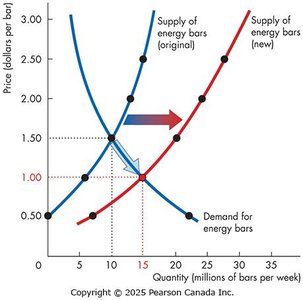
Simultaneous Shifts in Demand and Supply
Both Increase: Equilibrium quantity increases; price effect is uncertain.
Both Decrease: Equilibrium quantity decreases; price effect is uncertain.
Demand Increases, Supply Decreases: Price rises; quantity effect is uncertain.
Demand Decreases, Supply Increases: Price falls; quantity effect is uncertain.
Key Formulas:
Relative Price:
Equilibrium Condition: (Quantity demanded equals quantity supplied at equilibrium price)
