 뒤로
뒤로Efficiency and Equity in Competitive Markets: Microeconomics Study Guide
스터디 가이드 - 스마트 노트
 자료에 맞춘 맞춤형 노트, 핵심 정의, 예시, 맥락을 확장해 제공합니다.
Efficiency and Equity
Resource Allocation Methods
Scarce resources can be allocated through various methods, each with distinct implications for efficiency and fairness. Understanding these methods is essential for analyzing market outcomes.
Market Price: Resources go to those willing to pay the market price. Most goods and services are allocated this way, and it generally leads to efficient outcomes.
Command: Allocation by authority, common in organizations but inefficient for entire economies.
Majority Rule: Allocation based on majority voting, suitable for decisions affecting many people.
Contest: Resources awarded to winners, as in sports or competitions.
First-Come, First-Served: Allocation to those who arrive first, used in restaurants and checkouts.
Lottery: Random allocation, used when distinguishing among users is impractical.
Personal Characteristics: Allocation based on traits, often inefficient and biased.
Force: Allocation through coercion, historically significant but not efficient.
Benefit, Cost, and Surplus
Demand, Willingness to Pay, and Value
The value of a good is its marginal benefit, measured as the minimum price a person is willing to pay. Willingness to pay determines demand, and the demand curve represents marginal benefit.
Individual and Market Demand
Individual demand shows the relationship between price and quantity demanded for one person, while market demand aggregates all buyers. The market demand curve is the horizontal sum of individual demand curves.
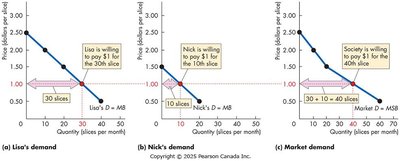
Consumer Surplus
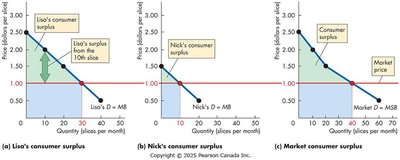
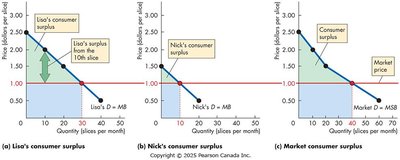
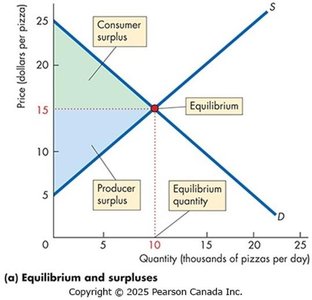
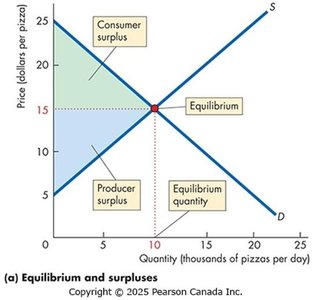
Consumer surplus is the excess benefit received from a good over the amount paid. It is calculated as the marginal benefit minus price, summed over the quantity bought. Graphically, it is the area under the demand curve and above the price line.
Example: If Lisa values the 10th slice at $2 and pays $1, her consumer surplus for that slice is $1.
Supply and Marginal Cost
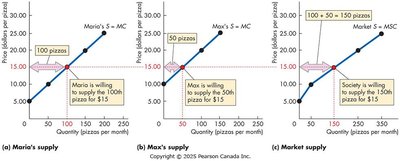
Firms supply goods to earn profit, distinguishing between cost (what is given up) and price (what is received). The cost of one more unit is its marginal cost, the minimum price a firm is willing to accept. The supply curve is a marginal cost curve.
Individual and Market Supply
Individual supply relates price to quantity supplied by one producer; market supply aggregates all producers. The market supply curve is the horizontal sum of individual supply curves.
Producer Surplus
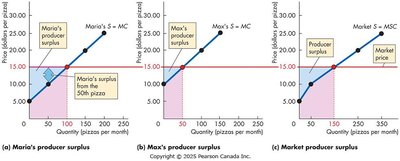
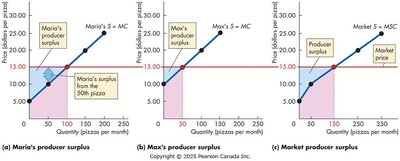
Producer surplus is the excess of the amount received from selling a good over the cost of producing it. It is calculated as price minus marginal cost, summed over the quantity sold. On a graph, it is the area below the price and above the supply curve.
Example: If Maria produces the 50th pizza for $10 and sells it for $15, her producer surplus for that pizza is $5.
Efficiency of Competitive Equilibrium
Efficient Allocation of Resources
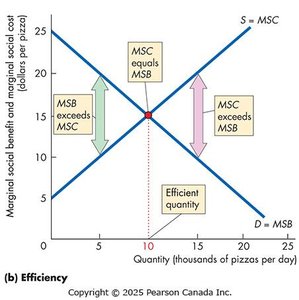
A competitive market achieves efficiency when the quantity demanded equals the quantity supplied at equilibrium. At this point, marginal social benefit (MSB) equals marginal social cost (MSC), and total surplus (consumer plus producer surplus) is maximized.
Market Failure
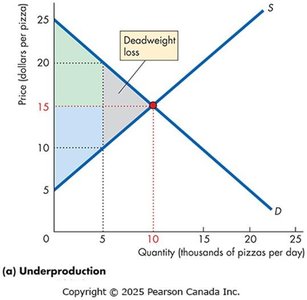
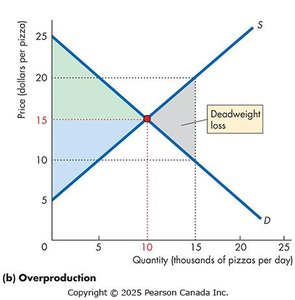
Markets may fail to achieve efficiency, resulting in underproduction or overproduction. Deadweight loss represents the decrease in total surplus due to inefficiency.
Underproduction: Too little is produced, MSB > MSC.
Overproduction: Too much is produced, MSC > MSB.
Sources of Market Failure
Price and Quantity Regulations: Can block price adjustments and limit production.
Taxes and Subsidies: Taxes decrease production (underproduction); subsidies increase production (overproduction).
Externalities: Costs or benefits affecting others, leading to overproduction (external costs) or underproduction (external benefits).
Public Goods: Non-excludable benefits lead to underproduction (free-rider problem).
Common Resources: Shared resources lead to overproduction (tragedy of the commons).
Monopoly: Single provider restricts output, causing underproduction.
High Transactions Costs: Markets may not operate efficiently if costs are too high.
Fairness in Competitive Markets
Concepts of Fairness
Fairness can be viewed as either fair results or fair rules.
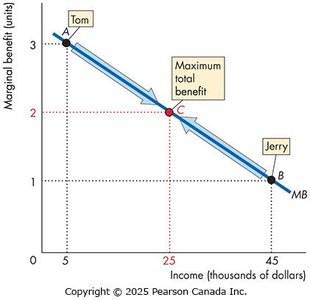
Utilitarianism: Efficiency is achieved only with equality. Redistribution increases total benefit if marginal benefit of income decreases as income increases.
Symmetry Principle: Fairness means treating people in similar situations similarly, emphasizing equality of opportunity.
Redistribution and the Big Tradeoff
Redistribution increases efficiency up to the point where the poorest are as well off as possible, but it involves tradeoffs between efficiency and fairness.
Robert Nozick's Rules: Fairness requires laws protecting private property and voluntary exchange.
Key Terms and Formulas
Marginal Benefit (MB): The value of one more unit of a good or service.
Marginal Cost (MC): The cost of producing one more unit.
Consumer Surplus: over all units bought.
Producer Surplus: over all units sold.
Total Surplus:
Deadweight Loss: Loss in total surplus due to market inefficiency.
Example Formula:
Additional info: These notes expand on the original slides by providing definitions, formulas, and context for each concept, ensuring completeness and academic quality for exam preparation.
