 뒤로
Efficiency and Equity in Microeconomics: Resource Allocation, Surplus, and Market Outcomes
스터디 가이드 - 스마트 노트
 자료에 맞춘 맞춤형 노트, 핵심 정의, 예시, 맥락을 확장해 제공합니다.
Efficiency and Equity
Resource Allocation Methods
Scarce resources can be allocated using various methods, each with distinct characteristics and implications for efficiency and fairness. Understanding these methods is essential for analyzing market and non-market outcomes.
Market Price: Resources go to those willing to pay the market price. Most goods and services are allocated this way, including labor and consumer products.
Command: Allocation is determined by authority, such as managers in firms or government officials. Works well in organizations but poorly in entire economies.
Majority Rule: Resources are allocated according to the preferences of the majority, often used for public decisions like tax rates.

Contest: Winners of competitions receive resources, common in sports and awards. Useful when monitoring individual effort is difficult.

First-Come, First-Served: Resources are given to those who arrive first, such as restaurant tables or supermarket checkouts.

Lottery: Allocation is random, used in state lotteries, airport slots, and marathons. Effective when users cannot be distinguished.

Personal Characteristics: Allocation based on traits, such as marriage partners or, less acceptably, discrimination.
Force: Allocation through coercion, including war, theft, or state intervention for redistribution.
Key Point: No single method is universally best; context determines efficiency and fairness.
Demand, Willingness to Pay, and Value
Demand reflects the value consumers place on goods, measured by their willingness to pay. The demand curve represents marginal benefit, and the maximum price a person is willing to pay for one more unit is its marginal benefit.
Individual Demand: Relationship between price and quantity demanded by one person.
Market Demand: Relationship between price and total quantity demanded by all buyers. The market demand curve is the horizontal sum of individual demand curves.
Example: If Lisa demands 30 slices of pizza at $1 each and Nick demands 10 slices at the same price, the market demand is 40 slices. 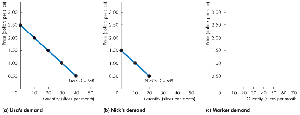
Consumer Surplus
Consumer surplus is the difference between the benefit received from a good and the amount paid for it. It is calculated as the area under the demand curve and above the price, up to the quantity bought.
Formula:
Graphical Representation: The green area under the demand curve and above the price line shows consumer surplus.
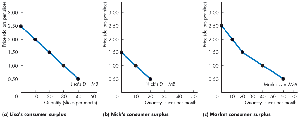
Example: At $1 per slice, Lisa's consumer surplus for the 10th slice is $2 (value) - $1 (price) = $1.
Supply, Cost, and Marginal Cost
Supply reflects the minimum price producers are willing to accept, which is their marginal cost. The supply curve is a marginal cost curve.
Individual Supply: Relationship between price and quantity supplied by one producer.
Market Supply: Relationship between price and total quantity supplied by all producers. The market supply curve is the horizontal sum of individual supply curves.
Example: If Maria supplies 100 pizzas at $15 each and Max supplies 50 pizzas at the same price, the market supply is 150 pizzas.
Producer Surplus
Producer surplus is the difference between the amount received from selling a good and the cost of producing it. It is shown as the area below the market price and above the supply curve, summed over the quantity sold.
Formula:
Graphical Representation: The blue area below the price line and above the supply curve shows producer surplus.
Example: If Maria is willing to produce the 50th pizza for $10 and sells it for $15, her surplus is $5.
Efficiency of Competitive Equilibrium
A competitive market is efficient when the quantity demanded equals the quantity supplied at equilibrium. Efficiency is achieved when marginal social benefit (MSB) equals marginal social cost (MSC).
Conditions:
Production less than equilibrium: MSB > MSC (underproduction)
Production greater than equilibrium: MSC > MSB (overproduction)
Production at equilibrium: MSB = MSC (efficient)
Total Surplus: The sum of consumer and producer surplus is maximized at the efficient quantity.
Market Failure
Market failure occurs when markets do not achieve efficient outcomes, resulting in underproduction or overproduction. Deadweight loss is the decrease in total surplus due to inefficiency.
Sources of Market Failure:
Price and quantity regulations
Taxes and subsidies
Externalities
Public goods and common resources
Monopoly
High transaction costs
Example: Underproduction (e.g., restricting pizza production to 5,000 when the efficient quantity is 10,000) creates a deadweight loss, shown as a gray triangle on the graph.
Fairness in Markets
Fairness can be evaluated by outcomes or rules:
Utilitarianism: Strives for the greatest happiness for the greatest number, advocating income redistribution for equality.
Symmetry Principle: Fairness is based on equal treatment and opportunity, not necessarily equal income. Private property and voluntary exchange are key.
The Big Tradeoff: Efficiency and fairness may conflict; redistributing income has costs that must be considered.
Summary Table: Resource Allocation Methods
Method | Description | Example |
|---|---|---|
Market Price | Allocation by willingness to pay | Labor market, consumer goods |
Command | Allocation by authority | Manager assigns tasks |
Majority Rule | Allocation by vote | Tax rates, public spending |
Contest | Allocation to winners | Sports, awards |
First-Come, First-Served | Allocation by order of arrival | Restaurant tables |
Lottery | Random allocation | Airport slots, marathons |
Personal Characteristics | Allocation by traits | Marriage partners |
Force | Allocation by coercion | War, theft, state redistribution |
Key Formulas
Consumer Surplus:
Producer Surplus:
Additional info:
Marginal social benefit (MSB) and marginal social cost (MSC) are central to efficiency analysis.
Deadweight loss quantifies the social cost of inefficiency.
Utilitarianism and the symmetry principle are foundational concepts in economic fairness debates.
