 뒤로
뒤로Microeconomics: Demand, Supply, and Market Equilibrium Practice Guidance
스터디 가이드 - 스마트 노트
 자료에 맞춘 맞춤형 노트, 핵심 정의, 예시, 맥락을 확장해 제공합니다.
Q1. If the price is set at $0.80 per cup, there is ________ leading to a price ________.
Background
Topic: Market Equilibrium, Surplus, and Shortage
This question tests your understanding of how market equilibrium is determined and what happens when the market price is not at equilibrium. You need to identify whether there is a surplus or shortage at a given price and predict the likely direction of price change.
Key Terms and Concepts:
Equilibrium Price: The price at which quantity demanded equals quantity supplied.
Shortage: Occurs when quantity demanded exceeds quantity supplied at a given price.
Surplus: Occurs when quantity supplied exceeds quantity demanded at a given price.
Step-by-Step Guidance
Find the quantity demanded and quantity supplied at the price of $0.80 per cup using the table provided.
Compare the quantity demanded and quantity supplied at this price.
If quantity demanded is greater than quantity supplied, a shortage exists; if quantity supplied is greater, a surplus exists.
Recall that shortages tend to push prices up, while surpluses tend to push prices down.
Try solving on your own before revealing the answer!
Final Answer: A) a shortage; rise
At $0.80, quantity demanded (1,100) is greater than quantity supplied (200), creating a shortage. This shortage puts upward pressure on the price.
Q2. At price P2 in Figure 3.4.1, which one of the following is not true?
Background
Topic: Market Equilibrium and Disequilibrium
This question asks you to interpret a supply and demand graph and identify which statement about equilibrium and quantities is incorrect at a specific price level.
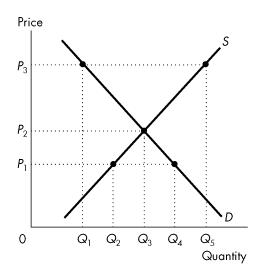
Key Terms and Concepts:
Equilibrium: The point where the supply and demand curves intersect (here, at P2 and Q3).
Quantity Supplied and Demanded: The amounts sellers and buyers are willing to exchange at a given price.
Step-by-Step Guidance
Locate price P2 on the graph and identify the corresponding quantity where supply and demand intersect (Q3).
Check which statements correctly describe the situation at P2 (e.g., is the market in equilibrium? Are quantities supplied and demanded equal?).
Identify which statement does NOT match the equilibrium condition at P2.
Try solving on your own before revealing the answer!
Final Answer: D) The quantity demanded is Q1.
At P2, the equilibrium quantity is Q3, not Q1. The other statements are true for equilibrium at P2.
Q3. Which market is an example of a market for goods?
Background
Topic: Types of Markets
This question tests your ability to distinguish between markets for goods and markets for factors of production or services.
Key Terms:
Goods Market: Where physical products are bought and sold.
Factor Market: Where resources like labor, land, and capital are traded.
Step-by-Step Guidance
Review the options and identify which ones refer to physical products (goods) versus services or factors of production.
Recall that goods are tangible items, while factors include labor and capital.
Try solving on your own before revealing the answer!
Final Answer: C) apple market
The apple market is a market for a physical good, while the others are for services or factors.
Q4. Good A is a normal good if...
Background
Topic: Types of Goods (Normal vs. Inferior)
This question tests your understanding of how changes in income affect demand for different types of goods.
Key Terms:
Normal Good: A good for which demand increases as consumer income rises.
Inferior Good: A good for which demand decreases as income rises.
Step-by-Step Guidance
Recall the definition of a normal good and how demand responds to income changes.
Review each option and identify which one matches the definition of a normal good.
Try solving on your own before revealing the answer!
Final Answer: A) the demand for A increases when income rises.
This is the definition of a normal good.
Q5. Bottled water and health club memberships are...
Background
Topic: Relationships Between Goods (Complements and Substitutes)
This question tests your understanding of how goods can be related as complements or substitutes in consumption.
Key Terms:
Complements: Goods that are often used together (e.g., coffee and sugar).
Substitutes: Goods that can replace each other (e.g., tea and coffee).
Step-by-Step Guidance
Think about whether bottled water and health club memberships are typically consumed together or instead of each other.
Recall that complements are used together, while substitutes are used in place of one another.
Try solving on your own before revealing the answer!
Final Answer: C) complements.
People who buy health club memberships often also buy bottled water, making them complements.
Q6. At a price of $10 a unit in Figure 3.4.2, what is the market situation?
Background
Topic: Surplus and Shortage in the Market
This question asks you to interpret a supply and demand graph to determine whether there is a surplus or shortage at a given price, and by how much.
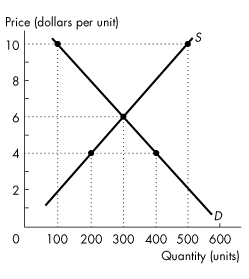
Key Terms and Concepts:
Surplus: Quantity supplied exceeds quantity demanded at a given price.
Shortage: Quantity demanded exceeds quantity supplied at a given price.
Step-by-Step Guidance
At the price of $10, use the graph to find the quantity supplied and the quantity demanded.
Calculate the difference between quantity supplied and quantity demanded at this price.
Determine whether this difference represents a surplus or a shortage.
Try solving on your own before revealing the answer!
Final Answer: C) there is a surplus of 400 units.
At $10, quantity supplied is 500 units and quantity demanded is 100 units, so there is a surplus of 400 units.
Q7. Refer to Table 3.5.1. The equilibrium price is $________ and the equilibrium quantity is ________ heaters per month.
Background
Topic: Finding Market Equilibrium from a Table
This question tests your ability to find the equilibrium price and quantity by matching quantity demanded and supplied from a table.
Key Terms and Concepts:
Equilibrium Price: The price at which quantity demanded equals quantity supplied.
Equilibrium Quantity: The quantity bought and sold at the equilibrium price.
Step-by-Step Guidance
Look at the table and find the price where quantity demanded equals quantity supplied.
Identify the corresponding quantity at this price.
Try solving on your own before revealing the answer!
Final Answer: C) 60; 400
At $60, both quantity demanded and supplied are 400 heaters per month, so this is the equilibrium.
Q8. If the number of suppliers of good Y increases, what happens to the supply curve?
Background
Topic: Shifts in Supply
This question tests your understanding of what causes the supply curve to shift and in which direction.
Key Terms:
Supply Curve: Shows the relationship between price and quantity supplied.
Rightward Shift: Indicates an increase in supply at every price.
Step-by-Step Guidance
Recall what happens to the supply curve when more suppliers enter the market.
Determine whether this causes a movement along the curve or a shift of the entire curve.
Try solving on your own before revealing the answer!
Final Answer: D) the supply curve of good Y shifts rightward.
More suppliers increase market supply, shifting the supply curve to the right.
Q9. When the demand for good A increases, what happens to equilibrium price and quantity?
Background
Topic: Effects of Demand Shifts on Equilibrium
This question tests your understanding of how an increase in demand affects equilibrium price and quantity in a competitive market.
Key Terms:
Equilibrium Price and Quantity: Determined by the intersection of supply and demand curves.
Increase in Demand: Shifts the demand curve rightward.
Step-by-Step Guidance
Visualize or sketch how the demand curve shifts when demand increases.
Observe what happens to the equilibrium point (where supply and demand intersect).
Determine the direction of change for both equilibrium price and quantity.
Try solving on your own before revealing the answer!
Final Answer: B) the equilibrium price and equilibrium quantity will increase.
An increase in demand raises both equilibrium price and quantity.
Q10. When the supply of good A decreases, what happens to equilibrium price and quantity?
Background
Topic: Effects of Supply Shifts on Equilibrium
This question tests your understanding of how a decrease in supply affects equilibrium price and quantity in a competitive market.
Key Terms:
Decrease in Supply: Shifts the supply curve leftward.
Equilibrium: The point where supply and demand curves intersect.
Step-by-Step Guidance
Visualize or sketch how the supply curve shifts when supply decreases.
Observe what happens to the equilibrium point (intersection of supply and demand).
Determine the direction of change for both equilibrium price and quantity.
Try solving on your own before revealing the answer!
Final Answer: C) the equilibrium price will increase, but the equilibrium quantity will decrease.
A decrease in supply raises the equilibrium price and lowers the equilibrium quantity.
