 뒤로
Microeconomics Study Guide: Consumer and Producer Theory, Elasticity, and Perfect Competition
스터디 가이드 - 스마트 노트
 자료에 맞춘 맞춤형 노트, 핵심 정의, 예시, 맥락을 확장해 제공합니다.
Consumers and Incentives
The Consumer's Problem
The consumer's problem in microeconomics is to maximize utility (benefit or satisfaction) from consuming goods and services, given their preferences, prices, and income. The utility function is typically written as , where and are quantities of two goods.
Utility: A measure of satisfaction or benefit from consumption.
Budget Constraint: The equation shows that total spending on goods cannot exceed income.
Budget Set: All combinations of goods that are affordable, i.e., .
Opportunity Cost: The value of what is given up to obtain something else, calculated as .
Budget Constraint and Opportunity Cost
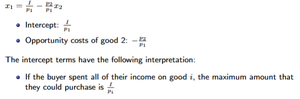
The budget constraint can be graphed in space, showing all combinations that exhaust the budget. The slope of the budget constraint, , represents the opportunity cost of purchasing an additional unit of good 1.
Intercepts: and are the maximum quantities of each good if all income is spent on one good.
Opportunity Cost of Good 2: .
Indifference Curves
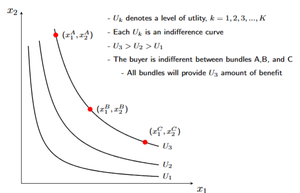
Indifference curves represent all combinations of goods that provide the same level of utility. Higher indifference curves correspond to higher utility levels. The slope of an indifference curve is , where is marginal utility.
Indifference curves never cross.
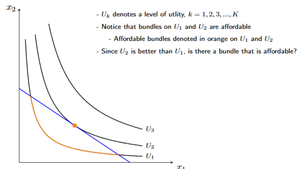
Tangent point: The optimal bundle is where the budget constraint is tangent to an indifference curve.
Effects of Price Changes
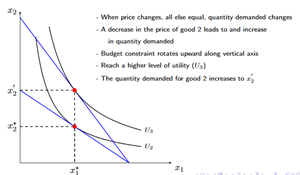
When the price of a good changes, the budget constraint rotates, and the consumer may reach a higher or lower utility level. The total effect of a price change is the sum of the substitution effect and the income effect.
Substitution Effect: Change in consumption due to relative price change.
Income Effect: Change in consumption due to change in purchasing power.
Elasticity
Price Elasticity of Demand
Elasticity measures how responsive buyers are to changes in price. The price elasticity of demand is always nonpositive due to the Law of Demand.
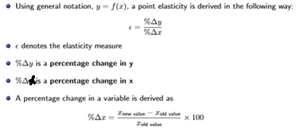
Point Elasticity: , where is the percentage change in quantity and is the percentage change in price.
Arc Elasticity
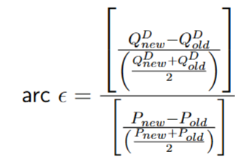
Arc elasticity measures average responsiveness between two points.
Formula:
Interpreting Elasticity
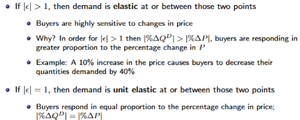
Elastic Demand (): Buyers are highly sensitive to price changes.
Unit Elastic (): Buyers respond in equal proportion to price changes.
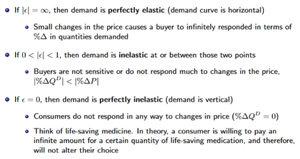
Perfectly Elastic (): Demand curve is horizontal; small price changes cause infinite response.
Inelastic (): Buyers are not sensitive to price changes.
Perfectly Inelastic (): Demand curve is vertical; quantity demanded does not change with price.
Sellers and Incentives
Cost Functions and Average Costs
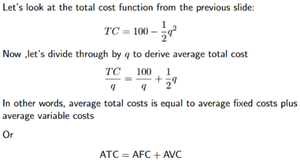
Firms face costs in production, which are divided into fixed and variable costs. The total cost function can be used to derive average total cost (ATC), average fixed cost (AFC), and average variable cost (AVC).
Total Cost Function:
Average Total Cost:
ATC = AFC + AVC
Marginal Cost and Average Cost Relationships
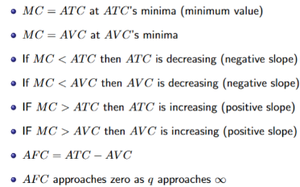
Marginal cost (MC) and average costs interact in predictable ways. The minimum points of ATC and AVC occur where MC equals ATC or AVC, respectively.
MC = ATC at ATC's minimum value
MC = AVC at AVC's minimum value
If MC < ATC, ATC is decreasing
If MC > ATC, ATC is increasing
AFC = ATC - AVC
AFC approaches zero as q approaches infinity
Shutdown Decisions
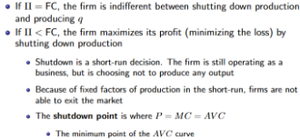
In the short run, firms may face the decision to shut down production. The shutdown point is where price equals marginal cost and average variable cost.
If profit equals fixed costs, the firm is indifferent between shutting down and producing.
If profit is less than fixed costs, the firm minimizes loss by shutting down.
Shutdown is a short-run decision; fixed factors prevent exit from the market.
The shutdown point is (minimum AVC).
Consumers: Budget Constraint and Opportunity Cost
Intercepts and Opportunity Cost
The intercepts of the budget constraint represent the maximum quantity of a good that can be purchased if all income is spent on that good. Opportunity cost is reflected in the slope of the budget constraint.
Intercept:
Opportunity cost of good 2:
If all income is spent on good , the maximum amount is
Indifference Curves and Utility Maximization
Indifference Curves
Indifference curves show combinations of goods that yield the same utility. The consumer is indifferent between bundles on the same curve, and higher curves represent higher utility.
denotes a level of utility
Each is an indifference curve
The buyer is indifferent between bundles A, B, and C on
Budget Constraint and Indifference Curve Tangency
The optimal consumption bundle is found where the budget constraint is tangent to the highest attainable indifference curve.
Bundles on and are affordable
Orange dot shows the tangent point
Is there a better affordable bundle?
Price Changes and Utility
When the price of a good changes, the budget constraint rotates, and the consumer may reach a higher utility level. The quantity demanded for good 2 increases as its price decreases.
Budget constraint rotates upward along vertical axis
Reach a higher level of utility ()
Quantity demanded for good 2 increases
Elasticity: Definitions and Formulas
Point Elasticity
Point elasticity measures the responsiveness of one variable to changes in another at a specific point.
is percentage change in
is percentage change in
Arc Elasticity
Arc elasticity calculates average responsiveness between two points.
Elasticity Interpretation
Elastic (): Highly sensitive to price changes; e.g., 10% price increase causes 40% decrease in quantity demanded.
Unit Elastic (): Equal proportion response.
Perfectly Elastic (): Horizontal demand curve; small price changes cause infinite response.
Inelastic (): Not sensitive to price changes.
Perfectly Inelastic (): Vertical demand curve; quantity does not change with price.
Producer Theory: Costs and Shutdown Decisions
Cost Functions and Average Costs
Firms analyze costs to determine optimal production. Average total cost is the sum of average fixed and average variable costs.
Marginal Cost and Average Cost Relationships
Marginal cost equals average cost at the minimum point of the average cost curve. If marginal cost is less than average cost, average cost decreases; if greater, average cost increases.
at ATC's minimum
at AVC's minimum
AFC approaches zero as increases
Shutdown Decisions
Firms may shut down in the short run if revenue does not cover variable costs. The shutdown point is where price equals marginal cost and average variable cost.
If profit equals fixed costs, the firm is indifferent between shutting down and producing.
If profit is less than fixed costs, the firm minimizes loss by shutting down.
Shutdown is a short-run decision; fixed factors prevent exit from the market.
The shutdown point is (minimum AVC).
