 뒤로
Microeconomics Study Guide: Consumer Surplus, Producer Surplus, and Elasticity
스터디 가이드 - 스마트 노트
 자료에 맞춘 맞춤형 노트, 핵심 정의, 예시, 맥락을 확장해 제공합니다.
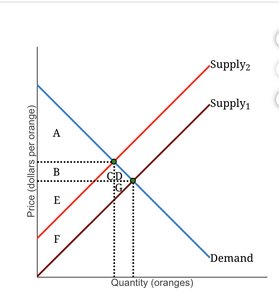
Q1. Suppose that a frost in Florida reduces the size of the orange crop, which causes the supply curve to shift to the left (from Supply 1 to Supply 2). As a result, consumer surplus ______.
Background
Topic: Consumer Surplus and Supply Shifts
This question tests your understanding of how a leftward shift in the supply curve (a decrease in supply) affects consumer surplus in a market. The graph provided shows the areas (A, B, C, D, E, F, G) that represent different parts of consumer and producer surplus before and after the supply shift.
Key Terms and Concepts:
Consumer Surplus: The difference between what consumers are willing to pay for a good and what they actually pay.
Supply Curve Shift: A leftward shift indicates a decrease in supply, usually leading to higher equilibrium prices and lower equilibrium quantities.
Step-by-Step Guidance
Examine the initial equilibrium (where Supply 1 intersects Demand) and identify the area representing consumer surplus (typically the area above the price and below the demand curve).
Identify the new equilibrium after the supply curve shifts left to Supply 2. Note the new price and quantity.
Determine which areas are lost from consumer surplus due to the higher price and lower quantity. Focus on the areas between the old and new supply curves, above the new price, and below the demand curve.
Compare the areas before and after the shift to see which specific labeled regions (B, C, D, G, etc.) are no longer part of consumer surplus.
Try solving on your own before revealing the answer!
Final Answer: A. decreases by areas B and C.
When the supply curve shifts left, consumer surplus decreases by the areas labeled B and C, which are lost due to the higher price and lower quantity available to consumers.
Q2. Suppose that a frost in Florida reduces the size of the orange crop, which causes the supply curve to shift to the left (from Supply 1 to Supply 2). Producer surplus ______.
Background
Topic: Producer Surplus and Supply Shifts
This question asks you to analyze how a decrease in supply (leftward shift) affects producer surplus, using the same labeled areas on the supply and demand graph.
Key Terms and Concepts:
Producer Surplus: The difference between the price producers receive and the minimum price at which they are willing to sell.
Supply Curve Shift: A leftward shift generally increases the price, which can increase producer surplus for the units still sold, but reduces the quantity sold.
Step-by-Step Guidance
Identify the initial producer surplus area (below the price and above the supply curve) at the original equilibrium.
After the supply curve shifts, find the new producer surplus area at the new equilibrium.
Determine which labeled areas are gained or lost by producers as a result of the shift.
Compare the areas before and after the shift to see which specific regions (B, C, D, F, G, etc.) are relevant to the change in producer surplus.
Try solving on your own before revealing the answer!
Final Answer: D. increases by area B and decreases by areas F and G.
Producer surplus increases by area B (gained due to higher price) but decreases by areas F and G (lost due to fewer units sold and higher costs for some producers).
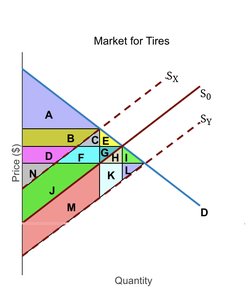
Q3. Refer to the graph and the shaded areas designated by letters A through N. Assume that S0 is the initial supply curve. These falling costs result in a consumer surplus in the market for tires represented by areas ______.
Background
Topic: Consumer Surplus and Supply Shifts (Cost Decrease)
This question examines how a decrease in production costs (rightward supply shift) affects consumer surplus, using a graph with multiple labeled areas.
Key Terms and Concepts:
Consumer Surplus: The area above the price and below the demand curve, up to the quantity sold.
Supply Curve Shift (Right): Indicates lower costs, leading to lower prices and higher quantities, increasing consumer surplus.
Step-by-Step Guidance
Identify the initial consumer surplus area at the original equilibrium (S0).
After the supply curve shifts right, find the new consumer surplus area at the new equilibrium.
Determine which labeled areas are now included in consumer surplus due to the lower price and higher quantity.
Compare the areas before and after the shift to see which specific regions (A, B, C, D, E, F, G, H, I, etc.) are now part of consumer surplus.
Try solving on your own before revealing the answer!
Final Answer: B. A, B, C, D, E, F, G, H, I.
After the supply curve shifts right, consumer surplus expands to include all the areas above the new price and below the demand curve, which are A, B, C, D, E, F, G, H, and I.
