 뒤로
뒤로Prosperity, Inequality, and Planetary Limits: Foundations of Microeconomics
스터디 가이드 - 스마트 노트
 자료에 맞춘 맞춤형 노트, 핵심 정의, 예시, 맥락을 확장해 제공합니다.
Unit 1: Prosperity, Inequality, and Planetary Limits
Introduction
This unit explores the interplay between economic growth, inequality, and environmental constraints. It introduces foundational concepts in microeconomics, including the measurement of prosperity, the distribution of income, and the relationship between economic systems and the biosphere.
Measuring Prosperity and Inequality
Gross Domestic Product (GDP) and Living Standards
Gross Domestic Product (GDP): The market value of all final goods and services produced within a country in a given period. Intermediate goods are excluded to prevent double counting.
GDP per capita: GDP divided by the population, representing average income if distributed equally.
Disposable income: Total income minus taxes plus government transfers. This is a better measure of individual well-being than GDP per capita alone.
Limitations of GDP: GDP does not account for the depletion of natural resources or environmental degradation, which can overstate true improvements in living standards.
Adjusting for Price Changes and International Comparisons
Real GDP: Adjusts nominal GDP for inflation, allowing for comparisons of purchasing power over time.
Purchasing Power Parity (PPP): Adjusts income measures so that a unit of currency has the same purchasing power across countries, facilitating meaningful international comparisons.
Income Inequality
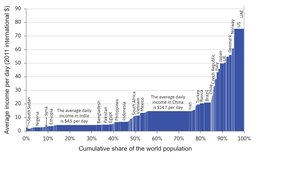
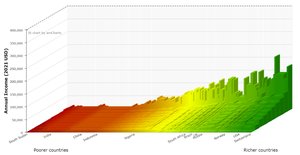
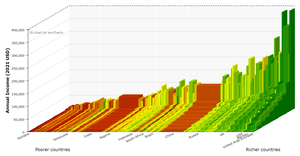
Income Distribution: Even if average income remains constant, changes in distribution can significantly affect overall well-being.
Measuring Inequality:
Lorenz Curve: Graphically represents the distribution of income or wealth among a population. The further the curve from the line of equality, the greater the inequality.
Gini Coefficient: A numerical measure of inequality, calculated as the area between the Lorenz curve and the line of equality divided by the total area under the line of equality. Ranges from 0 (perfect equality) to 1 (maximum inequality).
Other Ratios: S90/S10 (richest 10% to poorest 10%), S80/S20 (richest 20% to poorest 20%), Palma ratio (richest 10% to poorest 40%). Higher values indicate greater inequality.
Climate Change and Economic Growth
Environmental Impacts of Economic Activity
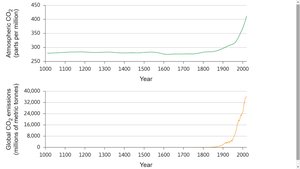
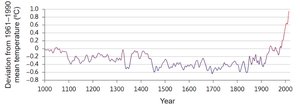
Climate Change: Economic growth has led to increased emissions of greenhouse gases, resulting in global warming, melting ice caps, rising sea levels, and changes in climate patterns.
Resource Depletion: Ignoring the depletion of natural resources can lead to overestimation of economic progress.
Explaining Economic Growth: The "Hockey-Stick" Curve
Patterns of GDP Growth
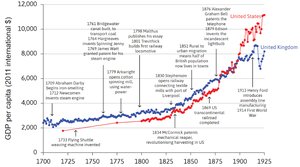
"Hockey-stick" Growth: Refers to the long period of stagnant GDP per capita followed by a sharp increase, especially after the Industrial Revolution.
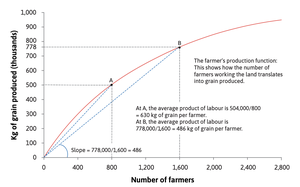
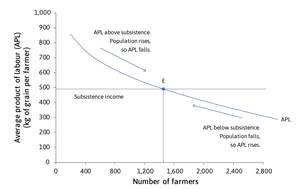
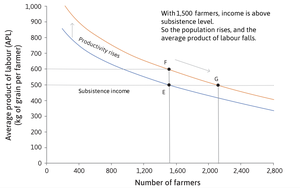
Malthusian Model: Explains the flat part of the curve. In pre-industrial societies, increases in income led to population growth, which in turn reduced average income due to diminishing returns in agriculture.
Technological Revolution: The Industrial Revolution introduced continuous technological progress, breaking the Malthusian trap and enabling sustained growth in living standards.
Malthusian Model and Production Functions
Factors of Production: Labour and land are the primary inputs in the Malthusian model.
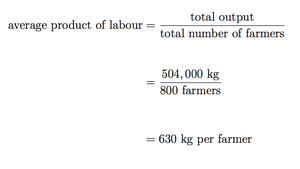
Production Function: Describes the relationship between inputs and output. In agriculture, adding more labour to fixed land leads to diminishing average product of labour.
Equilibrium: Achieved when population growth and income stabilize at subsistence levels.
Capitalism and Economic Systems
Institutions of Capitalism
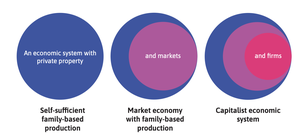
Capitalism: An economic system characterized by private property, markets, and firms.
Institutions: The formal and informal rules governing economic interactions, including laws protecting property rights and market regulations.
Firms: Organizations where owners of capital hire labour to produce goods and services for profit.
Markets: Mechanisms for buyers and sellers to exchange goods and services, potentially competitive or monopolistic.
Varieties and Dynamics of Capitalism
Developmental State: A form of capitalism where the government plays a leading role in economic development.
Dynamic Capitalism: Requires secure property rights, competitive markets, and effective legal systems.
Colonization: Colonial institutions often hindered economic development by prioritizing extraction over local prosperity.
The Economy and the Biosphere
Economics and the Environment
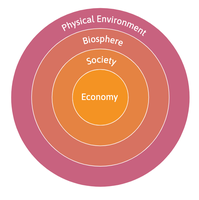
Biosphere: The global sum of all ecosystems, providing essential resources for economic activity.
Economic Interactions: Economics studies how people interact with each other and the environment to produce and acquire livelihoods.
Government Intervention: Environmental problems can be addressed through regulation, such as emission limits or tradable permits.
Summary Table: Key Measures of Inequality
Measure | Definition | Interpretation |
|---|---|---|
Lorenz Curve | Graphical representation of income/wealth distribution | Further from equality line = more inequality |
Gini Coefficient | Area between Lorenz curve and equality line / total area under equality line | 0 = perfect equality, 1 = maximum inequality |
S90/S10 Ratio | Income of richest 10% / income of poorest 10% | Higher ratio = more inequality |
Palma Ratio | Income share of richest 10% / income share of poorest 40% | Higher ratio = more inequality |
Conclusion
This unit provides a foundation for understanding how economic growth, inequality, and environmental limits are interconnected. It introduces key microeconomic concepts such as GDP, income distribution, production functions, and the role of institutions in shaping economic outcomes. The next unit will delve deeper into economic models explaining technological growth and the role of firms in development.
