 뒤로
Supply and Demand: The Foundations of Market Prices
스터디 가이드 - 스마트 노트
 자료에 맞춘 맞춤형 노트, 핵심 정의, 예시, 맥락을 확장해 제공합니다.
Where Prices Come From: The Interaction of Demand and Supply
Chapter Overview
This chapter explores how prices are determined in competitive markets through the interaction of demand and supply. It covers the concepts of demand and supply, the laws governing them, factors that cause shifts, and how equilibrium is established and altered by market forces.
The Demand Side of the Market
Demand Schedule, Quantity Demanded, and Demand Curve
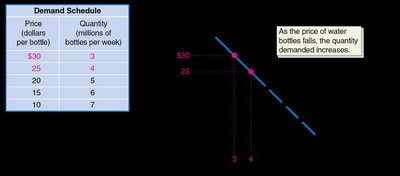
The demand schedule is a table showing the relationship between the price of a good and the quantity demanded at each price. The quantity demanded is the amount of a good consumers are willing and able to purchase at a specific price. The demand curve is a graphical representation of the demand schedule, typically downward sloping, reflecting the law of demand.
Law of Demand: Ceteris paribus (holding everything else constant), when the price of a product falls, the quantity demanded increases; when the price rises, the quantity demanded decreases.
Demand curves are downward sloping due to the substitution effect and income effect.
Shifts in Demand
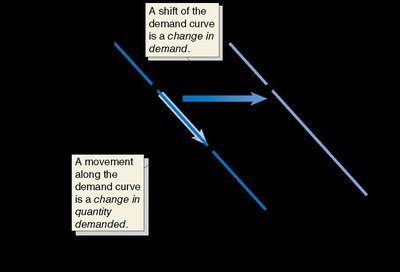
A change in demand refers to a shift of the entire demand curve, caused by factors other than the product's price. A change in quantity demanded is a movement along the same demand curve due to a change in the product's price.
Factors that Shift Market Demand:
Income: Normal goods (demand increases as income rises), Inferior goods (demand decreases as income rises)
Prices of related goods: Substitutes (goods used in place of each other), Complements (goods used together)
Tastes and preferences
Population and demographics
Expected future prices
Natural disasters and pandemics
The Supply Side of the Market
Supply Schedule, Quantity Supplied, and Supply Curve
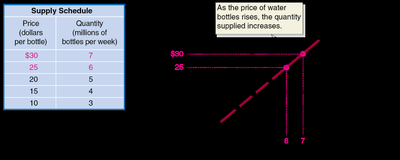
The supply schedule is a table showing the relationship between the price of a good and the quantity supplied at each price. The quantity supplied is the amount of a good that producers are willing and able to sell at a specific price. The supply curve is a graphical representation of the supply schedule, typically upward sloping, reflecting the law of supply.
Law of Supply: Ceteris paribus, when the price of a product rises, the quantity supplied increases; when the price falls, the quantity supplied decreases.
Supply curves are upward sloping due to increasing marginal costs.
Shifts in Supply
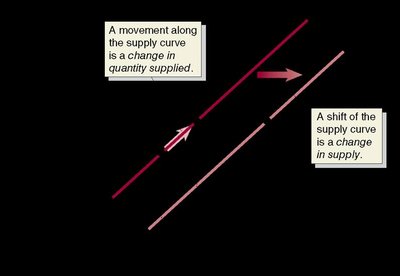
A change in supply refers to a shift of the entire supply curve, caused by factors other than the product's price. A change in quantity supplied is a movement along the same supply curve due to a change in the product's price.
Factors that Shift Market Supply:
Prices of inputs
Technological change
Prices of related goods in production: Substitutes and complements in production
Number of firms in the market
Expected future prices
Natural disasters and pandemics
Market Equilibrium: Putting Demand and Supply Together
Market Equilibrium
Market equilibrium occurs where the quantity demanded equals the quantity supplied. The corresponding price is the equilibrium price, and the quantity is the equilibrium quantity. At this point, there is no tendency for price to change unless an external factor shifts demand or supply.
Surplus: Occurs when quantity supplied exceeds quantity demanded at a given price (price above equilibrium).
Shortage: Occurs when quantity demanded exceeds quantity supplied at a given price (price below equilibrium).
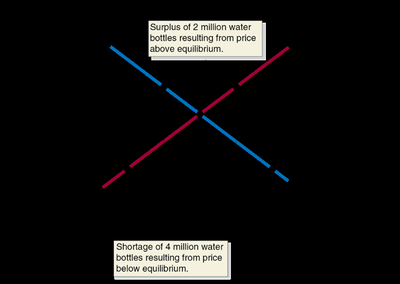
The Effect of Demand and Supply Shifts on Equilibrium
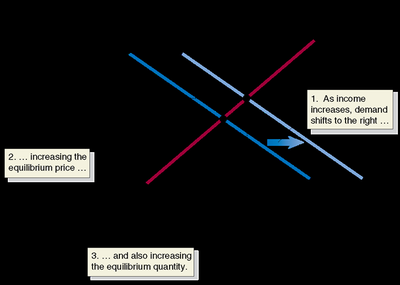
Effect of an Increase in Demand
An increase in demand (shift to the right of the demand curve) leads to a higher equilibrium price and a higher equilibrium quantity, ceteris paribus.
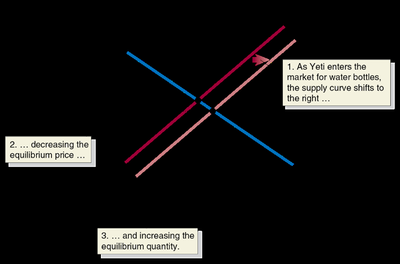
Effect of an Increase in Supply
An increase in supply (shift to the right of the supply curve) leads to a lower equilibrium price and a higher equilibrium quantity, ceteris paribus.
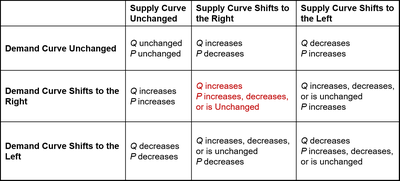
Summarizing Demand and Supply Shifts
The combined effects of shifts in demand and supply can be summarized in a table. The direction of change in equilibrium price and quantity depends on the magnitude and direction of the shifts.
Supply Curve Unchanged | Supply Curve Shifts to the Right | Supply Curve Shifts to the Left | |
|---|---|---|---|
Demand Curve Unchanged | Q unchanged P unchanged | Q increases P decreases | Q decreases P increases |
Demand Curve Shifts to the Right | Q increases P increases | Q increases P increases, decreases, or is unchanged | Q increases, decreases, or is unchanged P increases |
Demand Curve Shifts to the Left | Q decreases P decreases | Q increases, decreases, or is unchanged P decreases | Q decreases P increases, decreases, or is unchanged |
The Market System and the Role of Prices
Adam Smith and the Invisible Hand
Adam Smith described how individuals pursuing their own self-interest in a market system are led, as if by an "invisible hand," to promote the interests of society, even if that is not their intention. Market prices play a crucial role in coordinating economic activity.
Functions Performed by Market Prices
Prices communicate information about relative scarcity and value.
Prices coordinate the actions of buyers and sellers.
Prices motivate economic players to respond to incentives.
Summary and Applications
Variables that influence demand: income, prices of related goods, tastes, population, expectations, natural events.
Variables that influence supply: input prices, technology, related goods, number of firms, expectations, natural events.
Market equilibrium is illustrated using demand and supply graphs.
Demand and supply graphs can be used to predict changes in prices and quantities.
Example Applications:
How generational differences affect demand (e.g., preferences for technology).
Why oil production is sensitive to expectations of future prices.
How government policies can affect markets (e.g., recycled plastics).
Additional info: For practice, refer to tables summarizing demand and supply shifts, and consider real-world events such as the spike in used car prices during 2020-2022 as applications of these concepts.
