 뒤로
뒤로Supply, Demand, and Market Equilibrium: Core Microeconomics Concepts
스터디 가이드 - 스마트 노트
 자료에 맞춘 맞춤형 노트, 핵심 정의, 예시, 맥락을 확장해 제공합니다.
Supply and the Law of Supply
Definition and Key Principles
The concept of supply refers to the relationship between the price of a good and the quantity that producers are willing to bring to market. The Law of Supply states that, all else equal, as the price of a good or service increases, the quantity supplied also increases.
Change in Quantity Supplied: Movement along the supply curve due to a change in the good's price.
Change in Supply: A shift of the entire supply curve, caused by factors other than the good's price.
Determinants of Supply
Costs of Inputs: Higher input costs decrease supply; lower input costs increase supply.
Technology: Technological improvements increase supply by making production more efficient.
Number of Producers: More producers in the market increase supply.
Government Actions: Taxes increase production costs (decreasing supply); subsidies lower costs (increasing supply).
Producer Expectations: If producers expect higher future prices, they may reduce current supply; if they expect lower prices, they may increase current supply.
Price of Related Goods: If an alternative product becomes more profitable, producers may switch, decreasing supply of the original good.
Demand and the Determinants of Demand
Definition and Key Principles
Demand is the relationship between the price of a good and the quantity consumers are willing and able to purchase. The Law of Demand states that, all else equal, as the price of a good increases, the quantity demanded decreases.
Tastes & Preferences: Changes in consumer preferences can increase or decrease demand.
Income:
Normal Goods: Demand increases as income rises.
Inferior Goods: Demand decreases as income rises.
Price of Related Goods:
Substitutes: An increase in the price of one good increases demand for its substitute.
Complements: An increase in the price of one good decreases demand for its complement.
Number of Buyers: More buyers increase demand; fewer buyers decrease demand.
Expectations of Future Prices: If consumers expect prices to rise, current demand increases.
Government Actions: Subsidies and tax changes can affect consumers' ability to purchase goods.
Market Equilibrium
Definition and Graphical Representation
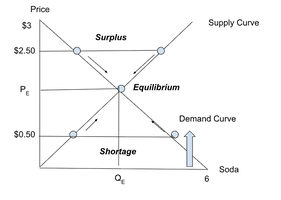
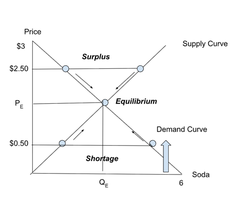
Market equilibrium occurs where the quantity demanded equals the quantity supplied. The equilibrium price (PE) and equilibrium quantity (QE) are determined at the intersection of the supply and demand curves. At this point, the market is allocatively efficient, maximizing social welfare.
Surplus: Occurs when price is above equilibrium; quantity supplied exceeds quantity demanded.
Shortage: Occurs when price is below equilibrium; quantity demanded exceeds quantity supplied.
Adjustments to Equilibrium
If there is a surplus, price will fall until equilibrium is restored.
If there is a shortage, price will rise until equilibrium is restored.
Solving Equilibrium Problems
Read the question carefully.
Draw a supply and demand graph.
Determine if demand changes (does the demand curve shift? Why?).
Determine if supply changes (does the supply curve shift? Why?).
Map the changes and observe the effects on equilibrium price and quantity.
Example: If the price of gasoline (a complement to SUVs) rises, demand for SUVs decreases, shifting the demand curve left. Equilibrium price and quantity both decrease.
Social Welfare, Consumer Surplus, and Producer Surplus
Definitions
Consumer Surplus: The difference between what consumers are willing to pay and what they actually pay. Graphically, it is the area above the market price and below the demand curve.
Producer Surplus: The difference between the price sellers receive and the minimum they are willing to accept. It is the area below the market price and above the supply curve.
Social Welfare: The sum of consumer surplus and producer surplus.
Formula:
Government Interventions: Price Floors and Ceilings
Price Ceilings
A price ceiling is a legal maximum price. If set below equilibrium, it causes a shortage (quantity demanded exceeds quantity supplied).
Consumer surplus and producer surplus are redistributed, and deadweight loss (loss of social welfare) occurs.
Price Floors
A price floor is a legal minimum price. If set above equilibrium, it causes a surplus (quantity supplied exceeds quantity demanded).
Summary Table: Determinants of Supply and Demand
Determinant | Effect on Demand | Effect on Supply |
|---|---|---|
Tastes & Preferences | Increase or decrease demand | None |
Income | Normal: ↑ demand; Inferior: ↓ demand | None |
Price of Related Goods | Substitutes: ↑ price of X → ↑ demand for Y Complements: ↑ price of X → ↓ demand for Y | If alternate good is more profitable, supply of original decreases |
Number of Buyers/Producers | More buyers → ↑ demand | More producers → ↑ supply |
Expectations | Expect higher future prices → ↑ current demand | Expect higher future prices → ↓ current supply |
Government Actions | Subsidies/tax cuts → ↑ demand | Taxes → ↓ supply; Subsidies → ↑ supply |
Costs/Technology | None | Lower costs/Better tech → ↑ supply |
