 뒤로
Taxation, Regulation, and Income Inequality: Microeconomic Study Guide
스터디 가이드 - 스마트 노트
 자료에 맞춘 맞춤형 노트, 핵심 정의, 예시, 맥락을 확장해 제공합니다.
The Government in the Economy: Taxation and Regulation
Introduction to Government Intervention
Governments play a crucial role in microeconomic markets by taxing citizens and corporations, regulating market activities, and redistributing income. These interventions aim to correct market failures, address externalities, raise revenues, and improve social well-being, though they may sometimes create inefficiencies.
Taxation: Used to raise revenue, correct market failures, redistribute income, and finance government operations.
Regulation: Includes direct regulation and price controls to influence market outcomes.
Equity vs. Efficiency: Economists weigh the trade-offs between equitable resource allocation and maximizing social surplus.
Optimal Size of Government
The optimal size of government is debated, with considerations for public projects, collective action, and the number of voices in decision-making. Large public projects often require government intervention for efficient provision.
Collective Action: The logic of collective action explains how individuals decide whether to lobby for government intervention, with outcomes depending on the number of participants and the costs/benefits involved.





Taxation and Government Spending
Why Does the Government Tax and Spend?
Government taxation and spending serve several purposes in microeconomics:
Raising revenues for public goods
Correcting market failures and externalities
Redistributing income to address fairness
Financing government operations
Tax Incidence and Deadweight Losses
Tax incidence refers to who bears the burden of a tax—consumers or producers. Deadweight loss (DWL) is the reduction in total surplus caused by the tax, and its magnitude depends on the elasticities of supply and demand.
Tax on Producers: Shifts the supply curve upward by the amount of the tax.
Tax on Consumers: Shifts the demand curve downward by the amount of the tax.
Formulas: and
Example: If , , and , equilibrium is found by setting .
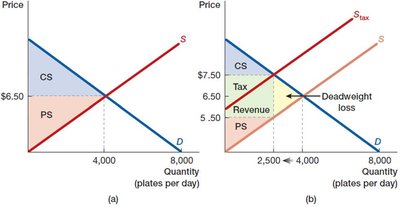
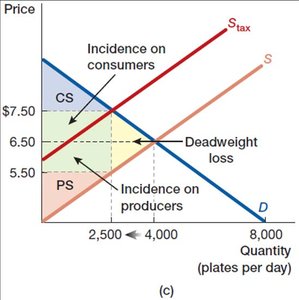
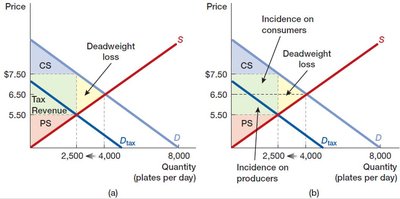
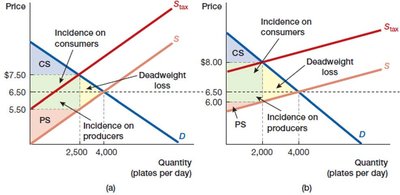
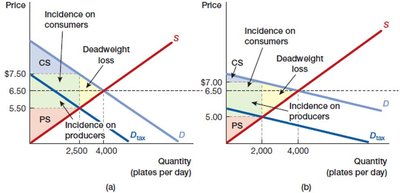
Elasticity and Tax Incidence
The division of tax burden depends on the relative elasticities of supply and demand:
If supply is more elastic than demand, consumers bear more of the tax burden.
If demand is more elastic than supply, producers bear more of the tax burden.
DWL is minimized on goods with inelastic demand or supply.
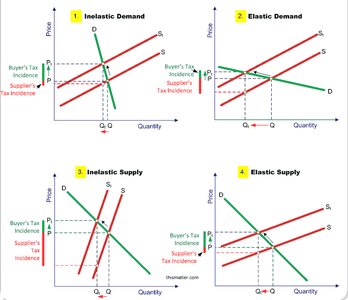
Logic of Collective Action
Collective action problems arise when individuals must decide whether to lobby against taxes. The Nash equilibrium changes as the number of participants increases, often leading to less lobbying as group size grows.
Game Theory Application: Payoff matrices and mixed strategy Nash equilibria are used to analyze lobbying behavior.
Formula: In symmetric Nash equilibrium,
Regulation: Direct Regulation and Price Controls
Direct Regulation
Direct regulation, also known as command-and-control regulation, involves government attempts to control the amount of an activity. Examples include environmental standards and quotas.
Price Controls: Price Ceilings and Price Floors
Price controls are government attempts to set maximum (price ceiling) or minimum (price floor) allowable prices for goods and services.
Price Ceiling: Maximum allowable price, often leading to shortages.
Price Floor: Minimum allowable price, often leading to surpluses.
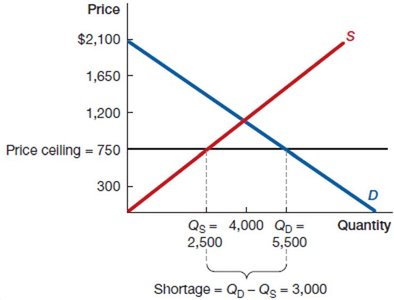
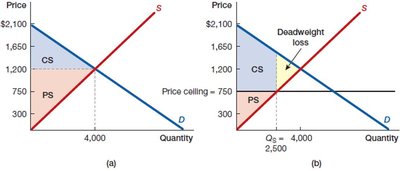
Applications: Shortages and Black Markets
Price ceilings can cause shortages, as seen in organ transplants and public school spaces. Black markets may arise when regulated prices are below equilibrium.
Example: The regulated price for a kidney is much lower than the black-market price, leading to shortages and illegal trade.




Income Tax Brackets and Tax Systems
Income Tax Brackets
Income tax brackets determine the marginal and average tax rates paid by individuals. The tax system can be progressive, proportional, or regressive.
Marginal Tax Rate: The rate paid on the last dollar of income.
Average Tax Rate: Total taxes divided by total income.
Progressive Tax System: Higher rates for higher incomes.
Proportional Tax System: Same rate for all incomes.
Regressive Tax System: Lower rates for higher incomes.
Tax System | Income | Percentage of Income Paid in Tax | Amount of Tax |
|---|---|---|---|
Progressive | $10,000 | 10% | $1,000 |
Progressive | $50,000 | 20% | $10,000 |
Progressive | $100,000 | 30% | $30,000 |
Proportional | $10,000 | 20% | $2,000 |
Proportional | $50,000 | 20% | $10,000 |
Proportional | $100,000 | 20% | $20,000 |
Regressive | $10,000 | 20% | $2,000 |
Regressive | $50,000 | 4% | $2,000 |
Regressive | $100,000 | 2% | $2,000 |
Inequality: The Gini Coefficient
Measuring Income Inequality
The Gini coefficient is a widely used measure of income inequality, calculated as the area between the line of equality and the Lorenz curve, divided by the total area under the line of equality.
Formula:
Interpretation: A Gini coefficient of 0 represents perfect equality, while 1 represents maximum inequality.
Equity versus Efficiency
Equity-Efficiency Trade-off
The equity-efficiency trade-off describes the balance between equitable allocation of resources and maximizing total output or social surplus. Policy decisions often involve weighing these competing goals.
Example: Sports leagues and livability indices may prioritize equity or efficiency differently.
Practice Problems
Supply and Demand with Price Floors and Taxes
Practice problems involve calculating equilibrium, deadweight loss, consumer and producer surplus, and tax incidence using supply and demand functions.
Example: For and , find equilibrium, analyze price floors, and calculate deadweight loss.
Tax Impact: Imposing a $3 tax shifts equilibrium and affects surplus and government revenue.
Income Tax Calculation
Calculate total tax and average tax rate for given income and tax brackets.
Example: For income, apply marginal rates to each bracket and sum for total tax.
Trade and Social Surplus
Analyze the impact of taxes on mutually beneficial trades, such as buying a couch with a willingness to pay and accept, and how taxes affect social surplus.
Example: If a $40 tax is imposed, social surplus decreases by the tax amount.
*Additional info: Academic context and explanations have been expanded for clarity and completeness. Images included are only those directly relevant to the microeconomic concepts discussed.*
