 뒤로
뒤로Mass Spectrometry in Organic Chemistry: Principles, Interpretation, and Applications
스터디 가이드 - 스마트 노트
 자료에 맞춘 맞춤형 노트, 핵심 정의, 예시, 맥락을 확장해 제공합니다.
Mass Spectrometry: Overview and Principles
Introduction to Mass Spectrometry
Mass spectrometry is a powerful analytical technique used in organic chemistry to determine the molecular weight, molecular formula, and structural features of organic compounds. It operates by ionizing molecules and analyzing the resulting ions based on their mass-to-charge ratio (m/z).
Ionization: A sample is vaporized and bombarded by a beam of electrons, forming an unstable radical cation (molecular ion).
Fragmentation: The molecular ion decomposes into smaller fragments, which are analyzed by the instrument.
Detection: The mass spectrometer records the intensity of each ion versus its m/z ratio, producing a mass spectrum.
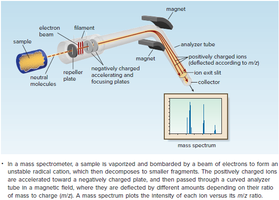
Formation of Molecular Ions and Fragmentation
The process of mass spectrometry begins with the ionization of a molecule (M) by an electron beam, resulting in a radical cation (M+•). This species is unstable and fragments into smaller ions and radicals.
Molecular Ion (M+•): Represents the intact molecule with a positive charge and an unpaired electron.
Fragment Ions: Result from the decomposition of the molecular ion, providing structural information.
Equation: 

Interpreting Mass Spectra
Key Features of a Mass Spectrum
A mass spectrum is a plot of ion abundance versus m/z. The tallest peak is the base peak, and the peak corresponding to the molecular ion is the M peak.
Base Peak: The most intense peak, set to 100% relative abundance.
M Peak: Represents the molecular ion; its m/z value gives the molecular weight.
M+1 Peak: Arises from isotopic variants (e.g., 13C in methane).
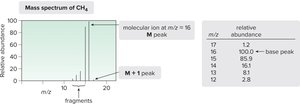
Fragmentation Patterns
The molecular ion is often unstable and fragments into ions with lower m/z values. For methane, fragments with one to four fewer hydrogen atoms than the parent molecule are observed.
Fragment Peaks: Indicate the presence of ions such as CH3+, CH2+, etc.

Mass Spectrum of Hexane
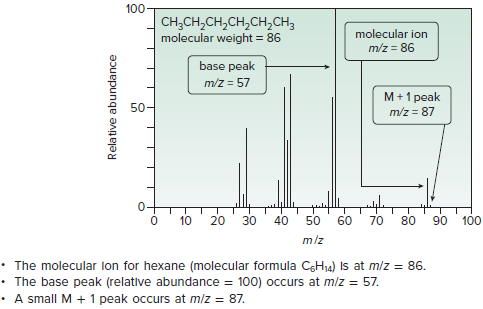
Hexane (C6H14) shows a molecular ion at m/z = 86, a base peak at m/z = 57, and an M+1 peak at m/z = 87. Major fragment peaks occur at m/z = 43 and 29.
Molecular Ion: m/z = 86
Base Peak: m/z = 57 (C4H7+)
M+1 Peak: m/z = 87
Fragment Peaks: m/z = 43 (C3H7+), m/z = 29 (C2H5+)
The Nitrogen Rule and Isotopic Patterns
The Nitrogen Rule
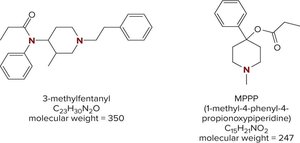
The nitrogen rule states that organic compounds with an odd number of nitrogen atoms have an odd molecular ion mass, while those with an even number of nitrogen atoms have an even molecular ion mass.
Hydrocarbons and C, H, O Compounds: Even molecular ion mass.
Compounds with Odd N: Odd molecular ion mass.
Proposing Molecular Formulas from Mass Spectra
Using Molecular Ion Mass
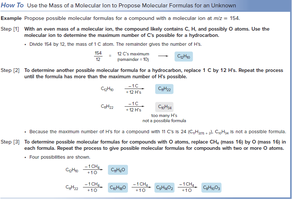
The mass of the molecular ion can be used to propose possible molecular formulas for unknown compounds.
Step 1: Use the molecular ion mass to determine the maximum number of C atoms.
Step 2: Replace C atoms with H atoms to find other possible formulas.
Step 3: Consider the presence of O atoms by replacing CH4 with O.
Alkyl Halides and Isotopic Peaks
M+2 Peaks in Alkyl Halides
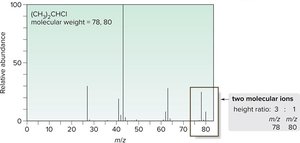
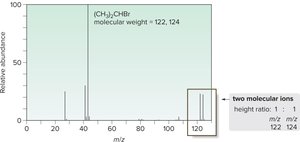
Alkyl halides exhibit characteristic M+2 peaks due to the presence of isotopes such as 37Cl and 81Br.
Chlorine: Two molecular ions (m/z = 78, 80) with a 3:1 height ratio.
Bromine: Two molecular ions (m/z = 122, 124) with a 1:1 height ratio.
Fragmentation Patterns and Structural Information
General Features of Fragmentation
Fragmentation patterns provide valuable structural information. Functional groups often exhibit characteristic fragmentation.
Loss of CH3: Forms a fragment 15 units less than the molecular ion.
C–C Bond Cleavage: Produces lower molecular weight fragments.
Fragmentation in Hexane
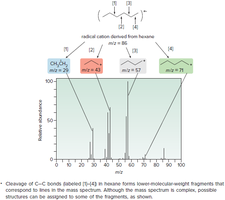
Cleavage of C–C bonds in hexane forms fragments corresponding to lines in the mass spectrum.
Fragments: m/z = 29 (C2H5+), m/z = 43 (C3H7+), m/z = 57 (C4H9+), m/z = 71 (C5H11+)
Fragmentation of Aldehydes and Ketones
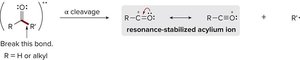
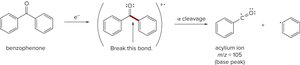
Aldehydes and ketones often undergo α cleavage, breaking the bond between the carbonyl carbon and an adjacent carbon, yielding a resonance-stabilized acylium ion.
α Cleavage: Produces acylium ion and neutral radical.
Fragmentation of Alcohols
Alcohols undergo α cleavage between an alkyl group and the carbon bearing the OH group, forming a resonance-stabilized carbocation. They can also undergo dehydration, forming water and a radical cation.
α Cleavage: Produces carbocation and neutral radical.
Dehydration: Forms alkene and water.


Fragmentation of Amines
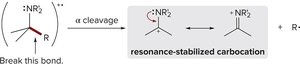
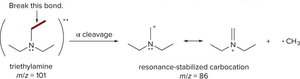
Amines fragment by α cleavage of the bond between an alkyl group and the carbon bearing the amine nitrogen, forming an alkyl radical and a resonance-stabilized carbocation.
α Cleavage: Produces carbocation and neutral radical.
High Resolution Mass Spectrometry
Exact Mass Determination
High resolution mass spectrometers measure m/z ratios to several decimal places, allowing for precise determination of molecular formulas.
Low Resolution: Reports m/z to nearest whole number.
High Resolution: Differentiates between compounds with similar nominal masses.
Gas Chromatography–Mass Spectrometry (GC-MS)
Principles and Applications
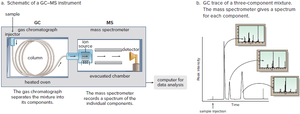
GC-MS combines gas chromatography and mass spectrometry to analyze mixtures of compounds.
Gas Chromatography: Separates mixture components based on boiling point and retention time.
Mass Spectrometry: Analyzes each component, providing mass spectra for identification.
Example: Analysis of THC
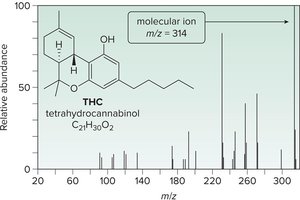
GC-MS can be used to analyze biological samples for organic compounds such as tetrahydrocannabinol (THC), the principal psychoactive component of marijuana.
THC: Appears as a GC peak; its mass spectrum shows a molecular ion at m/z = 314.
Summary Table: Mass Spectrometry Features
Feature | Description |
|---|---|
Molecular Ion (M+•) | Represents the intact molecule; m/z gives molecular weight |
Base Peak | Most intense peak; set to 100% relative abundance |
M+1 Peak | Isotopic peak (e.g., 13C) |
M+2 Peak | Characteristic of Cl and Br isotopes |
Fragment Peaks | Provide structural information |
Nitrogen Rule | Odd molecular ion mass indicates odd number of N atoms |
High Resolution | Allows exact mass determination and formula assignment |
GC-MS | Analyzes mixtures; separates and identifies components |
Conclusion
Mass spectrometry is an essential tool in organic chemistry for determining molecular weight, formula, and structural features. Understanding fragmentation patterns, isotopic peaks, and the nitrogen rule enables chemists to interpret spectra and identify unknown compounds. GC-MS extends these capabilities to complex mixtures, making mass spectrometry invaluable in both research and forensic applications.
