 뒤로
뒤로Analyzing Position vs. Time Graphs in Kinematics
스터디 가이드 - 스마트 노트
 자료에 맞춘 맞춤형 노트, 핵심 정의, 예시, 맥락을 확장해 제공합니다.
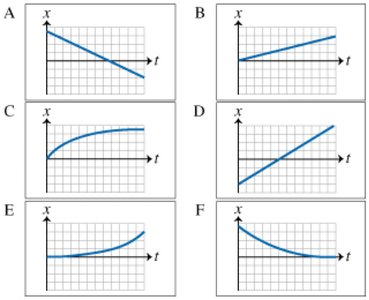
Q3. The graphs below describe the motion of different cars at a four-way stop. Take east to be positive. Choose the graph that best matches the described motion:
(a) The driver ignores the stop sign and continues to the east at constant speed.
(b) The driver ignores the stop sign and continues west at constant speed.
(c) The driver is traveling west and stops at the stop sign.
(d) After stopping the driver drives east with constant acceleration.
Background
Topic: Kinematics – Position vs. Time Graphs
This question tests your ability to interpret position vs. time graphs and relate them to real-world motion scenarios, including direction, speed, and acceleration.
Key Terms and Concepts
Position vs. Time Graph: Shows how an object's position changes over time.
Constant Speed: A straight line (linear) with constant slope; positive slope means motion east (positive direction), negative slope means motion west (negative direction).
Acceleration: A curved line; upward curve means increasing speed (acceleration), downward curve means decreasing speed (deceleration).
Stopping: Slope of the line becomes zero (horizontal line), indicating no change in position (object is at rest).
Step-by-Step Guidance
For each scenario, identify the key features: direction (east or west), whether the speed is constant or changing, and if/when the object stops.
Recall that a straight, upward-sloping line indicates constant positive velocity (east), while a straight, downward-sloping line indicates constant negative velocity (west).
For stopping, look for a segment where the graph becomes horizontal (slope = 0), indicating the object is at rest.
For constant acceleration, look for a curve where the slope increases over time (the graph gets steeper as time increases).
Match each scenario to the graph that best fits these descriptions, but stop before making the final assignments.
Try solving on your own before revealing the answer!
Final Answer:
(a) The driver ignores the stop sign and continues to the east at constant speed: Graph D (straight line, positive slope).
(b) The driver ignores the stop sign and continues west at constant speed: Graph A (straight line, negative slope).
(c) The driver is traveling west and stops at the stop sign: Graph F (starts with negative slope, then becomes horizontal).
(d) After stopping the driver drives east with constant acceleration: Graph E (starts flat, then curves upward).
Each graph's shape and slope correspond to the described motion: direction is shown by slope sign, constant speed by straight lines, stopping by horizontal segments, and acceleration by curves.
